Zip Codes with the Highest Percentage of Population Employed in Arts, Media & Entertainment in Eureka Springs, AR
RELATED REPORTS & OPTIONS
Arts, Media & Entertainment
Eureka Springs
Compare Zip Codes
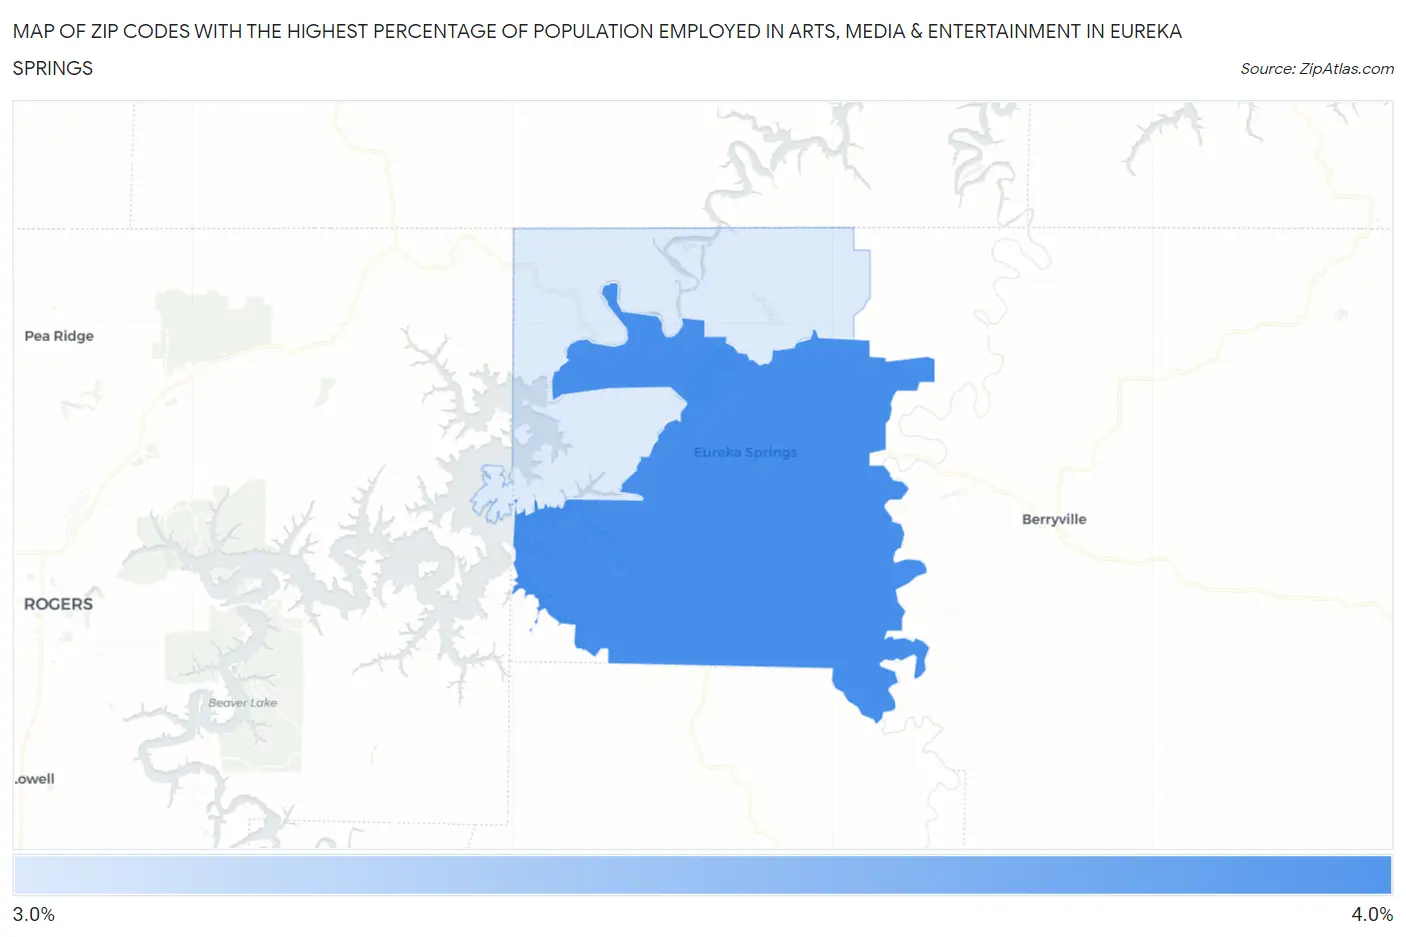
Map of Zip Codes with the Highest Percentage of Population Employed in Arts, Media & Entertainment in Eureka Springs
3.3%
3.4%
Zip Codes with the Highest Percentage of Population Employed in Arts, Media & Entertainment in Eureka Springs, AR
| Zip Code | % Employed | vs State | vs National | |
| 1. | 72632 | 3.4% | 1.3%(+2.10)#24 | 2.1%(+1.37)#3,179 |
| 2. | 72631 | 3.3% | 1.3%(+1.96)#27 | 2.1%(+1.22)#3,454 |
1
Common Questions
What are the Top Zip Codes with the Highest Percentage of Population Employed in Arts, Media & Entertainment in Eureka Springs, AR?
Top Zip Codes with the Highest Percentage of Population Employed in Arts, Media & Entertainment in Eureka Springs, AR are:
What zip code has the Highest Percentage of Population Employed in Arts, Media & Entertainment in Eureka Springs, AR?
72632 has the Highest Percentage of Population Employed in Arts, Media & Entertainment in Eureka Springs, AR with 3.4%.
What is the Percentage of Population Employed in Arts, Media & Entertainment in Eureka Springs, AR?
Percentage of Population Employed in Arts, Media & Entertainment in Eureka Springs is 2.2%.
What is the Percentage of Population Employed in Arts, Media & Entertainment in Arkansas?
Percentage of Population Employed in Arts, Media & Entertainment in Arkansas is 1.3%.
What is the Percentage of Population Employed in Arts, Media & Entertainment in the United States?
Percentage of Population Employed in Arts, Media & Entertainment in the United States is 2.1%.