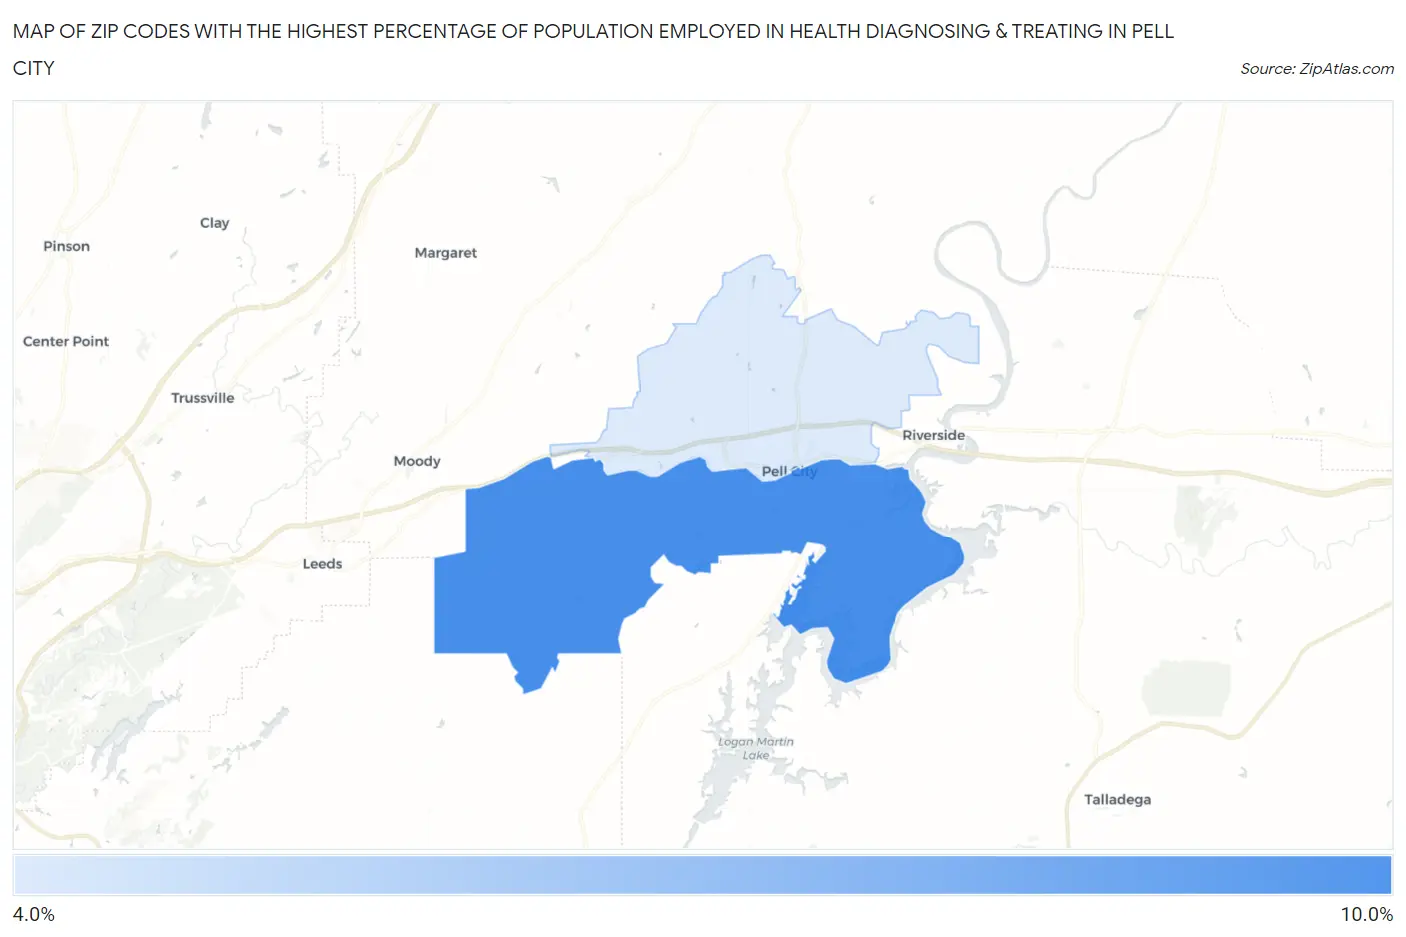
Zip Codes with the Highest Percentage of Population Employed in Health Diagnosing & Treating in Pell City, AL
RELATED REPORTS & OPTIONS
Health Diagnosing & Treating
Pell City
Compare Zip Codes
Map of Zip Codes with the Highest Percentage of Population Employed in Health Diagnosing & Treating in Pell City
4.1%
10.0%
Zip Codes with the Highest Percentage of Population Employed in Health Diagnosing & Treating in Pell City, AL
| Zip Code | % Employed | vs State | vs National | |
| 1. | 35128 | 10.0% | 7.0%(+2.98)#87 | 6.2%(+3.75)#3,906 |
| 2. | 35125 | 4.1% | 7.0%(-2.93)#421 | 6.2%(-2.15)#21,073 |
1
Common Questions
What are the Top Zip Codes with the Highest Percentage of Population Employed in Health Diagnosing & Treating in Pell City, AL?
Top Zip Codes with the Highest Percentage of Population Employed in Health Diagnosing & Treating in Pell City, AL are:
What zip code has the Highest Percentage of Population Employed in Health Diagnosing & Treating in Pell City, AL?
35128 has the Highest Percentage of Population Employed in Health Diagnosing & Treating in Pell City, AL with 10.0%.
What is the Percentage of Population Employed in Health Diagnosing & Treating in Pell City, AL?
Percentage of Population Employed in Health Diagnosing & Treating in Pell City is 8.2%.
What is the Percentage of Population Employed in Health Diagnosing & Treating in Alabama?
Percentage of Population Employed in Health Diagnosing & Treating in Alabama is 7.0%.
What is the Percentage of Population Employed in Health Diagnosing & Treating in the United States?
Percentage of Population Employed in Health Diagnosing & Treating in the United States is 6.2%.