Zip Codes with the Highest Percentage of Population Employed in Food Preparation & Serving in Pell City, AL
RELATED REPORTS & OPTIONS
Food Preparation & Serving
Pell City
Compare Zip Codes
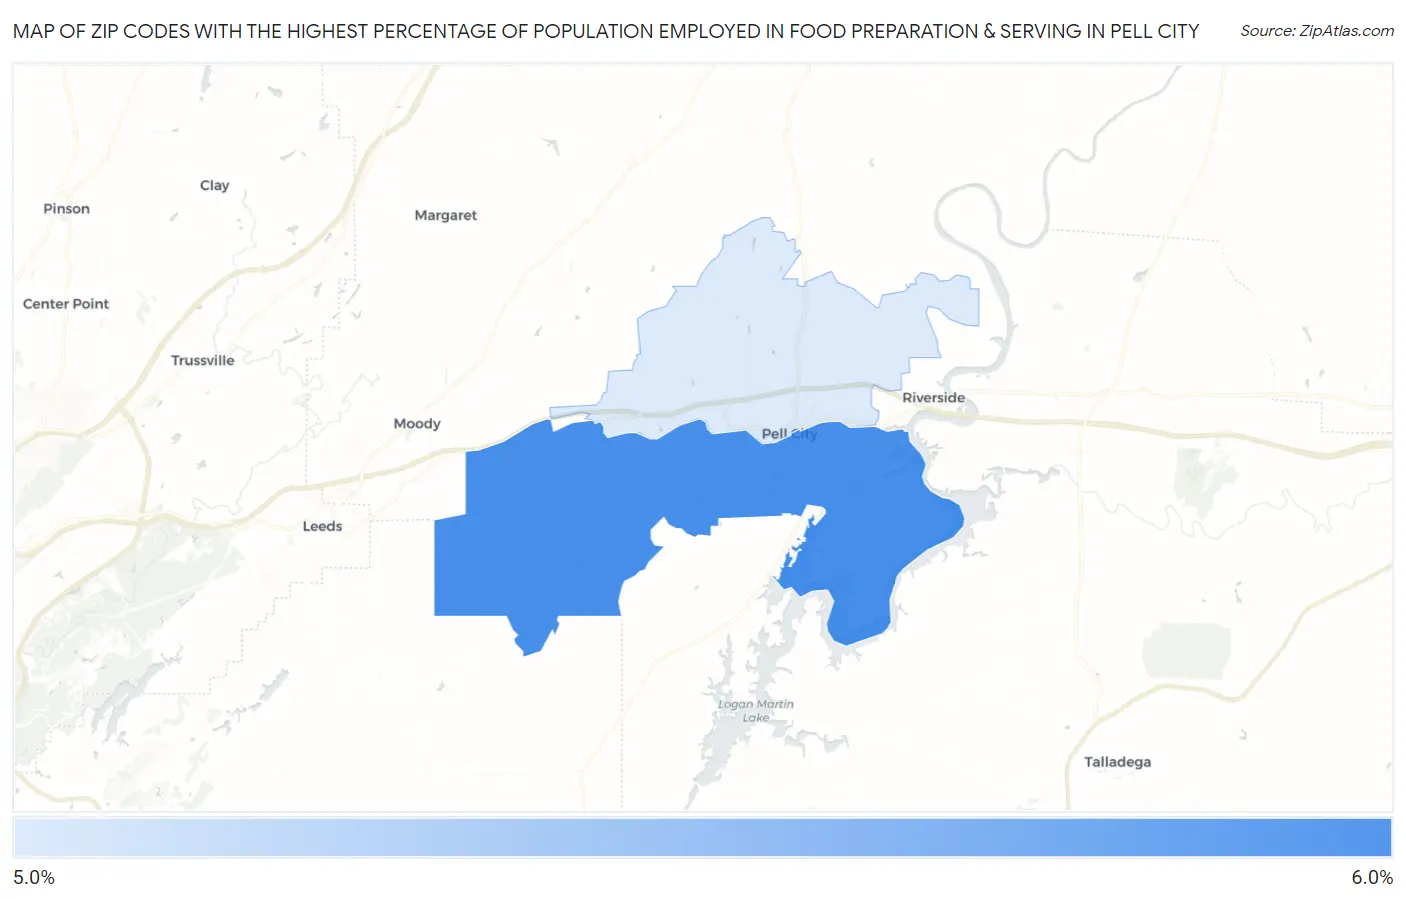
Map of Zip Codes with the Highest Percentage of Population Employed in Food Preparation & Serving in Pell City
5.1%
5.9%
Zip Codes with the Highest Percentage of Population Employed in Food Preparation & Serving in Pell City, AL
| Zip Code | % Employed | vs State | vs National | |
| 1. | 35128 | 5.9% | 5.2%(+0.717)#183 | 5.3%(+0.631)#9,611 |
| 2. | 35125 | 5.1% | 5.2%(-0.084)#243 | 5.3%(-0.170)#12,479 |
1
Common Questions
What are the Top Zip Codes with the Highest Percentage of Population Employed in Food Preparation & Serving in Pell City, AL?
Top Zip Codes with the Highest Percentage of Population Employed in Food Preparation & Serving in Pell City, AL are:
What zip code has the Highest Percentage of Population Employed in Food Preparation & Serving in Pell City, AL?
35128 has the Highest Percentage of Population Employed in Food Preparation & Serving in Pell City, AL with 5.9%.
What is the Percentage of Population Employed in Food Preparation & Serving in Pell City, AL?
Percentage of Population Employed in Food Preparation & Serving in Pell City is 7.6%.
What is the Percentage of Population Employed in Food Preparation & Serving in Alabama?
Percentage of Population Employed in Food Preparation & Serving in Alabama is 5.2%.
What is the Percentage of Population Employed in Food Preparation & Serving in the United States?
Percentage of Population Employed in Food Preparation & Serving in the United States is 5.3%.