Zip Codes with the Highest Percentage of Population Employed in Arts, Entertainment & Recreation in Mobile, AL
RELATED REPORTS & OPTIONS
Arts, Entertainment & Recreation
Mobile
Compare Zip Codes
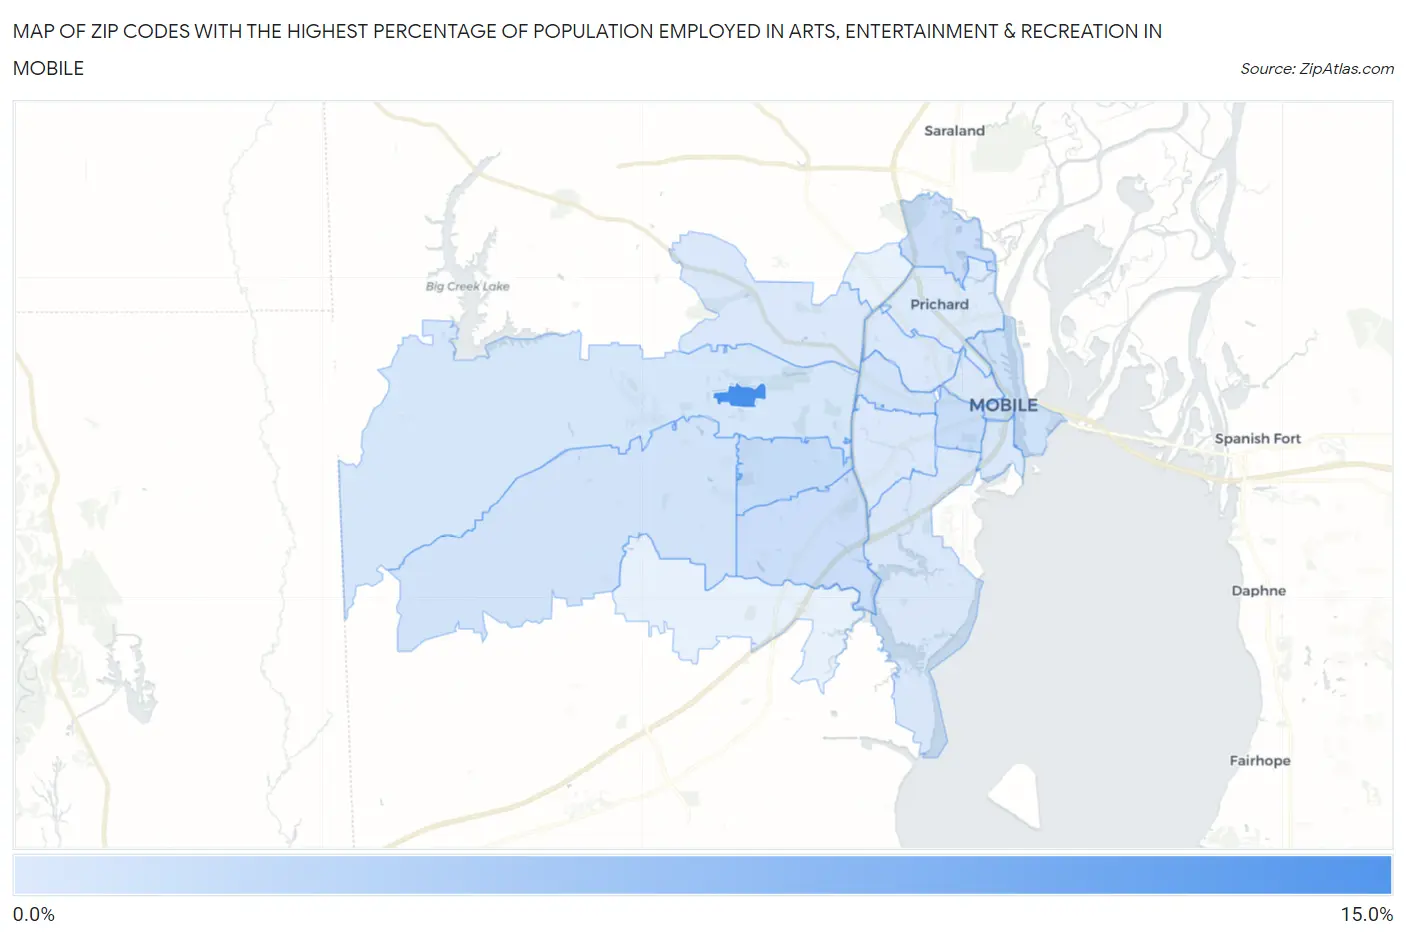
Map of Zip Codes with the Highest Percentage of Population Employed in Arts, Entertainment & Recreation in Mobile
0.0%
15.0%
Zip Codes with the Highest Percentage of Population Employed in Arts, Entertainment & Recreation in Mobile, AL
| Zip Code | % Employed | vs State | vs National | |
| 1. | 36688 | 14.3% | 1.4%(+12.9)#5 | 2.1%(+12.2)#371 |
| 2. | 36609 | 2.6% | 1.4%(+1.26)#73 | 2.1%(+0.549)#6,633 |
| 3. | 36604 | 2.3% | 1.4%(+0.931)#87 | 2.1%(+0.216)#8,134 |
| 4. | 36693 | 2.1% | 1.4%(+0.725)#98 | 2.1%(+0.009)#9,262 |
| 5. | 36611 | 2.1% | 1.4%(+0.687)#103 | 2.1%(-0.028)#9,472 |
| 6. | 36602 | 1.8% | 1.4%(+0.401)#132 | 2.1%(-0.315)#11,242 |
| 7. | 36607 | 1.6% | 1.4%(+0.185)#150 | 2.1%(-0.530)#12,834 |
| 8. | 36695 | 1.5% | 1.4%(+0.175)#152 | 2.1%(-0.540)#12,940 |
| 9. | 36608 | 1.2% | 1.4%(-0.199)#193 | 2.1%(-0.914)#15,723 |
| 10. | 36605 | 0.93% | 1.4%(-0.442)#236 | 2.1%(-1.16)#17,506 |
| 11. | 36603 | 0.91% | 1.4%(-0.454)#240 | 2.1%(-1.17)#17,594 |
| 12. | 36618 | 0.80% | 1.4%(-0.569)#263 | 2.1%(-1.28)#18,417 |
| 13. | 36606 | 0.79% | 1.4%(-0.579)#266 | 2.1%(-1.29)#18,490 |
| 14. | 36617 | 0.72% | 1.4%(-0.649)#277 | 2.1%(-1.36)#19,014 |
| 15. | 36610 | 0.56% | 1.4%(-0.812)#311 | 2.1%(-1.53)#20,134 |
1
Common Questions
What are the Top 10 Zip Codes with the Highest Percentage of Population Employed in Arts, Entertainment & Recreation in Mobile, AL?
Top 10 Zip Codes with the Highest Percentage of Population Employed in Arts, Entertainment & Recreation in Mobile, AL are:
What zip code has the Highest Percentage of Population Employed in Arts, Entertainment & Recreation in Mobile, AL?
36688 has the Highest Percentage of Population Employed in Arts, Entertainment & Recreation in Mobile, AL with 14.3%.
What is the Percentage of Population Employed in Arts, Entertainment & Recreation in Mobile, AL?
Percentage of Population Employed in Arts, Entertainment & Recreation in Mobile is 1.7%.
What is the Percentage of Population Employed in Arts, Entertainment & Recreation in Alabama?
Percentage of Population Employed in Arts, Entertainment & Recreation in Alabama is 1.4%.
What is the Percentage of Population Employed in Arts, Entertainment & Recreation in the United States?
Percentage of Population Employed in Arts, Entertainment & Recreation in the United States is 2.1%.