Zip Codes with the Highest Percentage of Population Employed in Farming, Fishing & Forestry in Birmingham, AL

RELATED REPORTS & OPTIONS

Farming, Fishing & Forestry
Population
Families and Households
Female Fertility
Female Fertility (Unmarried)
Race (Community Size)
Race (Percentage)
Ancestry (Community Size)
AfricanAlbanianAmericanArabArgentineanAustralianAustrianBahamianBelgianBelizeanBhutaneseBlackfeetBrazilianBritishBurmeseCajunCanadianCelticCentral AmericanCentral American IndianCherokeeChileanChoctawColombianCosta RicanCreekCroatianCubanCzechCzechoslovakianDanishDominicanDutchEastern EuropeanEcuadorianEgyptianEnglishEthiopianEuropeanFilipinoFinnishFrenchFrench CanadianGermanGreekGuatemalanGuyaneseHaitianHonduranHungarianIcelanderIndian (Asian)InupiatIranianIraqiIrishItalianJamaicanJordanianKenyanKoreanLaotianLatvianLebaneseLithuanianMalaysianMexicanMexican American IndianMoroccanNative HawaiianNavajoNew ZealanderNicaraguanNigerianNorthern EuropeanNorwegianPakistaniPalestinianPanamanianPennsylvania GermanPeruvianPolishPortuguesePuerto RicanRomanianRussianSalvadoranSamoanScandinavianScotch-IrishScottishSeminoleSiouxSlavicSlovakSloveneSouth AfricanSouth AmericanSouth American IndianSpaniardSpanishSri LankanSubsaharan AfricanSwedishSwissSyrianThaiTurkishUkrainianVenezuelanVietnameseWelshWest IndianYugoslavian
Ancestry (Percentage)
AfricanAlbanianAmericanArabArgentineanAustralianAustrianBahamianBelgianBelizeanBhutaneseBlackfeetBrazilianBritishBurmeseCajunCanadianCelticCentral AmericanCentral American IndianCherokeeChileanChoctawColombianCosta RicanCreekCroatianCubanCzechCzechoslovakianDanishDominicanDutchEastern EuropeanEcuadorianEgyptianEnglishEthiopianEuropeanFilipinoFinnishFrenchFrench CanadianGermanGreekGuatemalanGuyaneseHaitianHonduranHungarianIcelanderIndian (Asian)InupiatIranianIraqiIrishItalianJamaicanJordanianKenyanKoreanLaotianLatvianLebaneseLithuanianMalaysianMexicanMexican American IndianMoroccanNative HawaiianNavajoNew ZealanderNicaraguanNigerianNorthern EuropeanNorwegianPakistaniPalestinianPanamanianPennsylvania GermanPeruvianPolishPortuguesePuerto RicanRomanianRussianSalvadoranSamoanScandinavianScotch-IrishScottishSeminoleSiouxSlavicSlovakSloveneSouth AfricanSouth AmericanSouth American IndianSpaniardSpanishSri LankanSubsaharan AfricanSwedishSwissSyrianThaiTurkishUkrainianVenezuelanVietnameseWelshWest IndianYugoslavian
Immigrant Origin (Total)
Immigrant Origin (Percentage)
Income
Income (Families)
Income (Households)
Poverty
Poverty (Families)
Unemployment
Employment Occupations
Employment Industries
Employer Class
Commute Time
Commute Means
School Enrollment
Education by Degree Field
Occupancy
Finances
Physical Characteristics
Birmingham
Compare Zip Codes
Comparison Subject

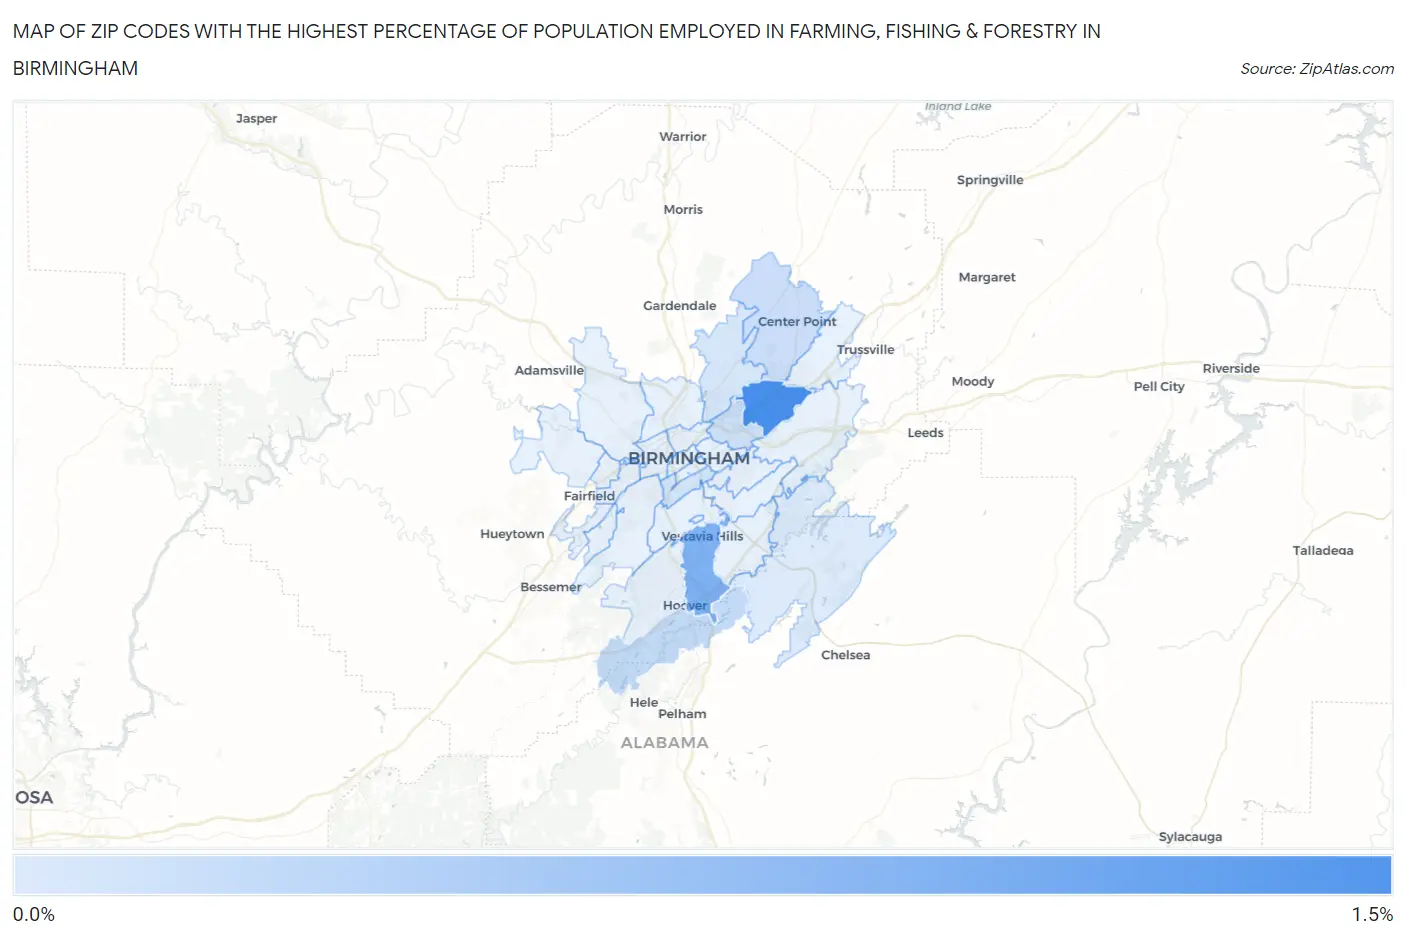
Map of Zip Codes with the Highest Percentage of Population Employed in Farming, Fishing & Forestry in Birmingham

0.0%
1.5%
Zip Codes with the Highest Percentage of Population Employed in Farming, Fishing & Forestry in Birmingham Map

Zip Codes with the Highest Percentage of Population Employed in Farming, Fishing & Forestry in Birmingham, AL

Zip Code % Employed vs State vs National
1.352061.4%0.42%(+0.982)#930.61%(+0.794)#8,208
2.352160.90%0.42%(+0.482)#1410.61%(+0.294)#10,235
3.352440.31%0.42%(-0.109)#2200.61%(-0.296)#14,721
4.352150.23%0.42%(-0.185)#2410.61%(-0.373)#15,649
5.352120.20%0.42%(-0.218)#2550.61%(-0.405)#16,129
6.352050.15%0.42%(-0.268)#2730.61%(-0.456)#16,918
7.352170.13%0.42%(-0.283)#2780.61%(-0.471)#17,193
8.352420.076%0.42%(-0.341)#2990.61%(-0.529)#18,187

Common Questions

What are the Top 10 Zip Codes with the Highest Percentage of Population Employed in Farming, Fishing & Forestry in Birmingham, AL?
Top 10 Zip Codes with the Highest Percentage of Population Employed in Farming, Fishing & Forestry in Birmingham, AL are:
#1
1.4%
#2
0.90%
#3
0.31%
#4
0.23%
#5
0.20%
#6
0.15%
#7
0.13%
#8
0.076%
#9
0.0%
#10
0.0%
What zip code has the Highest Percentage of Population Employed in Farming, Fishing & Forestry in Birmingham, AL?
35206 has the Highest Percentage of Population Employed in Farming, Fishing & Forestry in Birmingham, AL with 1.4%.
What is the Percentage of Population Employed in Farming, Fishing & Forestry in Birmingham, AL?
Percentage of Population Employed in Farming, Fishing & Forestry in Birmingham is 0.19%.
What is the Percentage of Population Employed in Farming, Fishing & Forestry in Alabama?
Percentage of Population Employed in Farming, Fishing & Forestry in Alabama is 0.42%.
What is the Percentage of Population Employed in Farming, Fishing & Forestry in the United States?
Percentage of Population Employed in Farming, Fishing & Forestry in the United States is 0.61%.