Zip Codes with the Highest Percentage of Population Employed in Construction & Extraction in Birmingham, AL
RELATED REPORTS & OPTIONS
Construction & Extraction
Birmingham
Compare Zip Codes
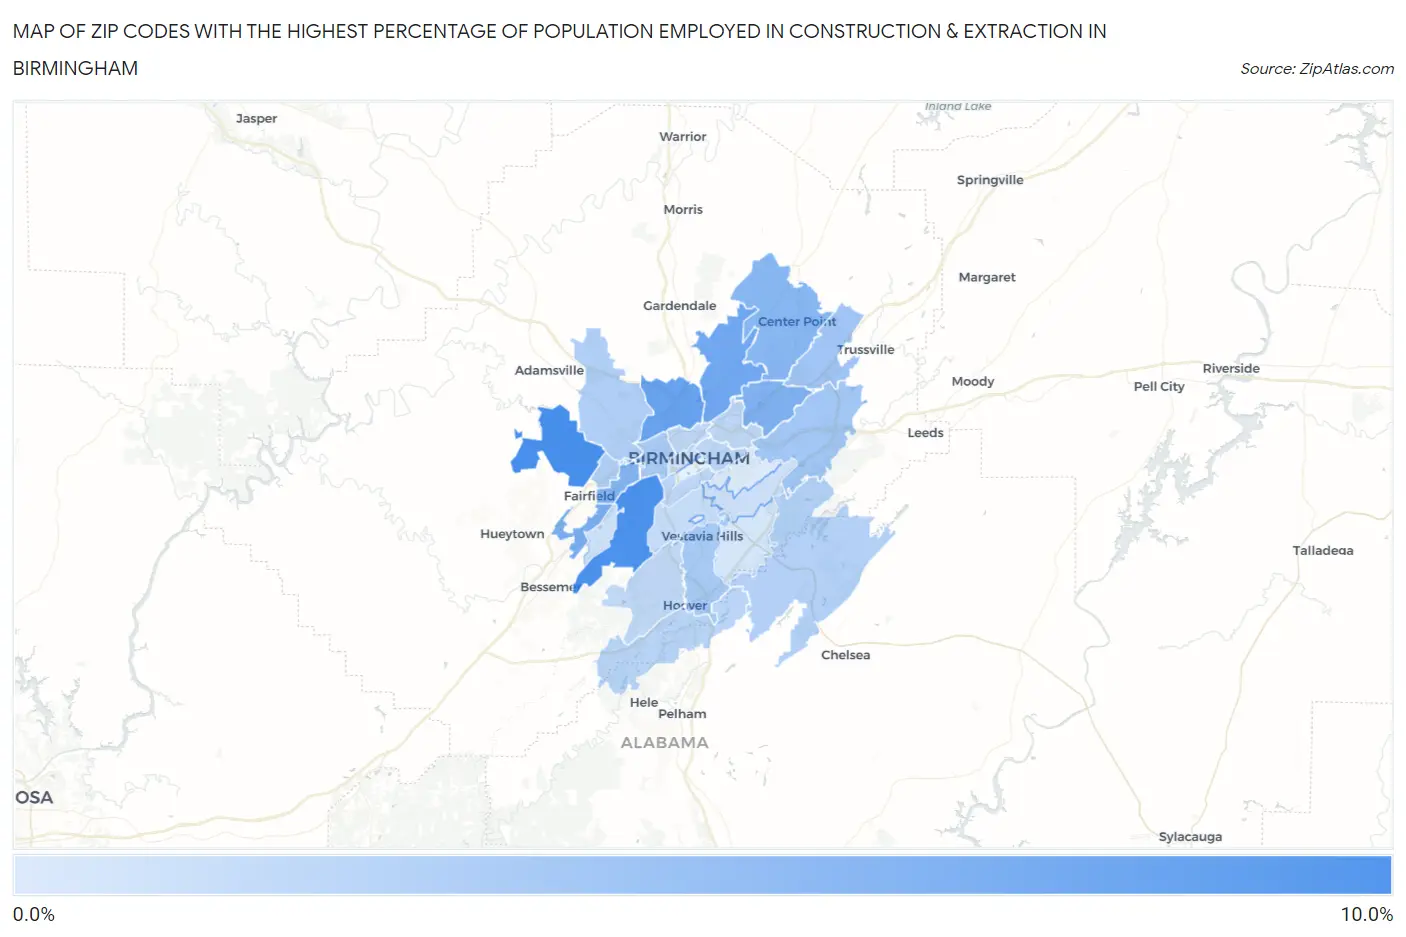
Map of Zip Codes with the Highest Percentage of Population Employed in Construction & Extraction in Birmingham
0.0%
10.0%
Zip Codes with the Highest Percentage of Population Employed in Construction & Extraction in Birmingham, AL
| Zip Code | % Employed | vs State | vs National | |
| 1. | 35224 | 9.1% | 5.2%(+3.88)#118 | 5.0%(+4.09)#6,639 |
| 2. | 35211 | 8.8% | 5.2%(+3.59)#134 | 5.0%(+3.81)#7,086 |
| 3. | 35207 | 7.2% | 5.2%(+1.95)#197 | 5.0%(+2.16)#10,325 |
| 4. | 35217 | 6.6% | 5.2%(+1.38)#235 | 5.0%(+1.59)#11,801 |
| 5. | 35228 | 5.9% | 5.2%(+0.705)#278 | 5.0%(+0.919)#13,738 |
| 6. | 35206 | 5.6% | 5.2%(+0.436)#294 | 5.0%(+0.650)#14,567 |
| 7. | 35208 | 5.5% | 5.2%(+0.249)#304 | 5.0%(+0.463)#15,187 |
| 8. | 35215 | 5.2% | 5.2%(+0.004)#319 | 5.0%(+0.218)#16,014 |
| 9. | 35235 | 3.7% | 5.2%(-1.54)#412 | 5.0%(-1.33)#21,466 |
| 10. | 35210 | 3.5% | 5.2%(-1.71)#427 | 5.0%(-1.49)#22,010 |
| 11. | 35216 | 3.3% | 5.2%(-1.90)#433 | 5.0%(-1.68)#22,604 |
| 12. | 35204 | 3.0% | 5.2%(-2.22)#448 | 5.0%(-2.00)#23,618 |
| 13. | 35218 | 2.8% | 5.2%(-2.43)#464 | 5.0%(-2.22)#24,260 |
| 14. | 35214 | 2.7% | 5.2%(-2.50)#467 | 5.0%(-2.28)#24,455 |
| 15. | 35242 | 2.6% | 5.2%(-2.58)#471 | 5.0%(-2.37)#24,708 |
| 16. | 35244 | 2.2% | 5.2%(-2.96)#483 | 5.0%(-2.75)#25,716 |
| 17. | 35222 | 2.0% | 5.2%(-3.17)#496 | 5.0%(-2.95)#26,232 |
| 18. | 35212 | 2.0% | 5.2%(-3.18)#498 | 5.0%(-2.97)#26,261 |
| 19. | 35205 | 1.9% | 5.2%(-3.27)#507 | 5.0%(-3.06)#26,490 |
| 20. | 35234 | 1.9% | 5.2%(-3.29)#508 | 5.0%(-3.08)#26,555 |
| 21. | 35226 | 1.8% | 5.2%(-3.40)#515 | 5.0%(-3.19)#26,771 |
| 22. | 35209 | 1.6% | 5.2%(-3.58)#523 | 5.0%(-3.37)#27,160 |
| 23. | 35223 | 1.2% | 5.2%(-4.01)#537 | 5.0%(-3.80)#28,000 |
| 24. | 35221 | 1.1% | 5.2%(-4.14)#540 | 5.0%(-3.92)#28,206 |
| 25. | 35203 | 1.1% | 5.2%(-4.15)#541 | 5.0%(-3.94)#28,229 |
| 26. | 35243 | 0.72% | 5.2%(-4.49)#552 | 5.0%(-4.28)#28,708 |
| 27. | 35213 | 0.26% | 5.2%(-4.95)#556 | 5.0%(-4.73)#29,093 |
1
Common Questions
What are the Top 10 Zip Codes with the Highest Percentage of Population Employed in Construction & Extraction in Birmingham, AL?
Top 10 Zip Codes with the Highest Percentage of Population Employed in Construction & Extraction in Birmingham, AL are:
What zip code has the Highest Percentage of Population Employed in Construction & Extraction in Birmingham, AL?
35224 has the Highest Percentage of Population Employed in Construction & Extraction in Birmingham, AL with 9.1%.
What is the Percentage of Population Employed in Construction & Extraction in Birmingham, AL?
Percentage of Population Employed in Construction & Extraction in Birmingham is 4.1%.
What is the Percentage of Population Employed in Construction & Extraction in Alabama?
Percentage of Population Employed in Construction & Extraction in Alabama is 5.2%.
What is the Percentage of Population Employed in Construction & Extraction in the United States?
Percentage of Population Employed in Construction & Extraction in the United States is 5.0%.