Zip Codes with the Highest Percentage of Population Taking Taxi / Cab to Work in Newport, RI
RELATED REPORTS & OPTIONS
Taxi / Cab
Newport
Compare Zip Codes
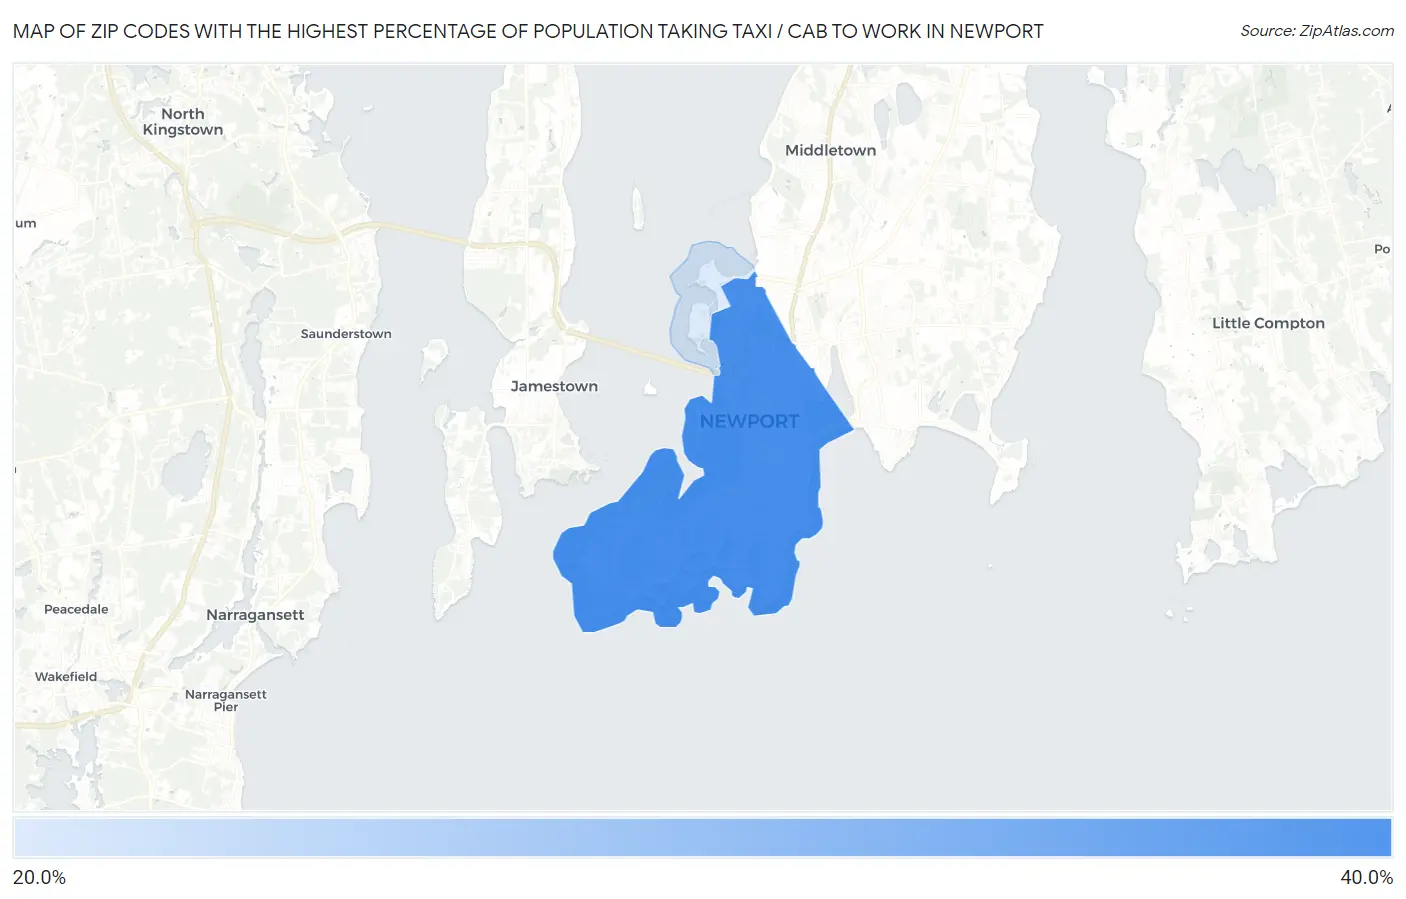
Map of Zip Codes with the Highest Percentage of Population Taking Taxi / Cab to Work in Newport
24.1%
37.5%
Zip Codes with the Highest Percentage of Population Taking Taxi / Cab to Work in Newport, RI
| Zip Code | % Take Taxi / Cab | vs State | vs National | |
| 1. | 02840 | 37.5% | 37.4%(+0.100)#23 | 38.2%(-0.700)#7,723 |
| 2. | 02841 | 24.1% | 37.4%(-13.3)#41 | 38.2%(-14.1)#12,429 |
1
Common Questions
What are the Top Zip Codes with the Highest Percentage of Population Taking Taxi / Cab to Work in Newport, RI?
Top Zip Codes with the Highest Percentage of Population Taking Taxi / Cab to Work in Newport, RI are:
What zip code has the Highest Percentage of Population Taking Taxi / Cab to Work in Newport, RI?
02840 has the Highest Percentage of Population Taking Taxi / Cab to Work in Newport, RI with 37.5%.
What is the Percentage of Population Taking Taxi / Cab to Work in Newport, RI?
Percentage of Population Taking Taxi / Cab to Work in Newport is 37.1%.
What is the Percentage of Population Taking Taxi / Cab to Work in Rhode Island?
Percentage of Population Taking Taxi / Cab to Work in Rhode Island is 37.4%.
What is the Percentage of Population Taking Taxi / Cab to Work in the United States?
Percentage of Population Taking Taxi / Cab to Work in the United States is 38.2%.