Zip Codes with the Highest Percentage of Population Employed in Food Preparation & Serving in Milwaukee, WI
RELATED REPORTS & OPTIONS
Food Preparation & Serving
Milwaukee
Compare Zip Codes
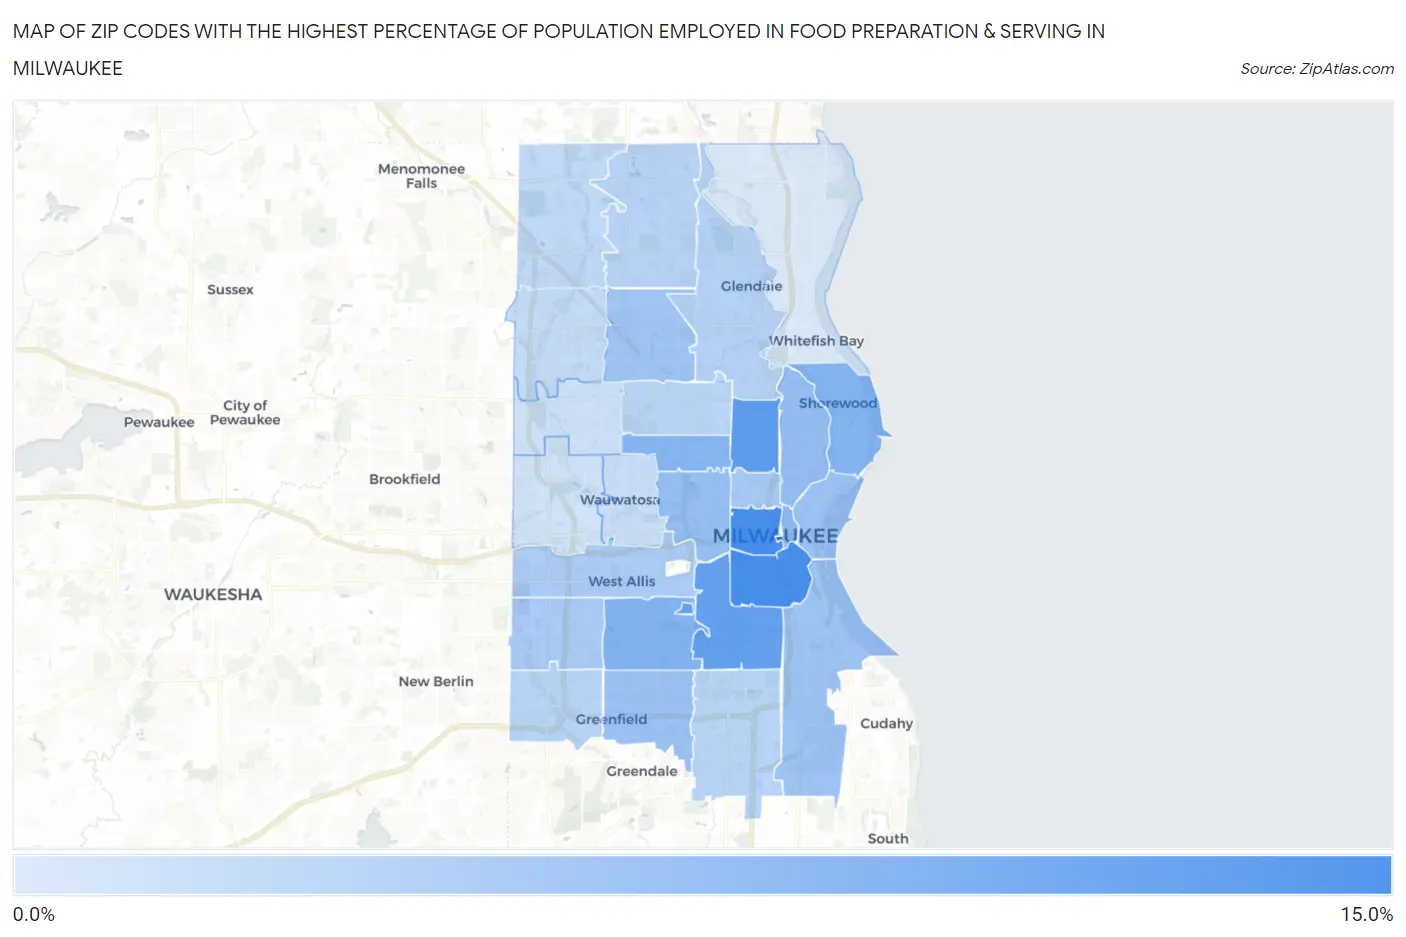
Map of Zip Codes with the Highest Percentage of Population Employed in Food Preparation & Serving in Milwaukee
2.7%
10.4%
Zip Codes with the Highest Percentage of Population Employed in Food Preparation & Serving in Milwaukee, WI
| Zip Code | % Employed | vs State | vs National | |
| 1. | 53204 | 10.4% | 5.0%(+5.44)#21 | 5.3%(+5.14)#2,359 |
| 2. | 53233 | 10.4% | 5.0%(+5.42)#22 | 5.3%(+5.12)#2,372 |
| 3. | 53206 | 9.2% | 5.0%(+4.17)#36 | 5.3%(+3.88)#3,361 |
| 4. | 53215 | 9.0% | 5.0%(+3.97)#39 | 5.3%(+3.67)#3,564 |
| 5. | 53219 | 7.3% | 5.0%(+2.28)#84 | 5.3%(+1.98)#5,993 |
| 6. | 53211 | 7.1% | 5.0%(+2.14)#92 | 5.3%(+1.84)#6,283 |
| 7. | 53210 | 7.0% | 5.0%(+2.01)#99 | 5.3%(+1.71)#6,575 |
| 8. | 53203 | 6.7% | 5.0%(+1.76)#114 | 5.3%(+1.46)#7,222 |
| 9. | 53212 | 6.4% | 5.0%(+1.45)#125 | 5.3%(+1.15)#8,040 |
| 10. | 53208 | 6.2% | 5.0%(+1.25)#139 | 5.3%(+0.953)#8,618 |
| 11. | 53202 | 6.1% | 5.0%(+1.12)#150 | 5.3%(+0.819)#9,003 |
| 12. | 53220 | 5.9% | 5.0%(+0.954)#158 | 5.3%(+0.656)#9,537 |
| 13. | 53207 | 5.8% | 5.0%(+0.773)#190 | 5.3%(+0.474)#10,151 |
| 14. | 53218 | 5.7% | 5.0%(+0.706)#196 | 5.3%(+0.407)#10,372 |
| 15. | 53205 | 5.4% | 5.0%(+0.406)#227 | 5.3%(+0.107)#11,430 |
| 16. | 53227 | 5.3% | 5.0%(+0.281)#243 | 5.3%(-0.017)#11,871 |
| 17. | 53214 | 5.0% | 5.0%(+0.062)#269 | 5.3%(-0.237)#12,748 |
| 18. | 53209 | 4.6% | 5.0%(-0.376)#326 | 5.3%(-0.675)#14,545 |
| 19. | 53223 | 4.5% | 5.0%(-0.466)#338 | 5.3%(-0.765)#14,930 |
| 20. | 53228 | 4.4% | 5.0%(-0.575)#355 | 5.3%(-0.874)#15,360 |
| 21. | 53216 | 4.4% | 5.0%(-0.581)#357 | 5.3%(-0.880)#15,393 |
| 22. | 53221 | 4.3% | 5.0%(-0.642)#362 | 5.3%(-0.940)#15,674 |
| 23. | 53224 | 4.1% | 5.0%(-0.931)#413 | 5.3%(-1.23)#16,905 |
| 24. | 53225 | 3.8% | 5.0%(-1.15)#450 | 5.3%(-1.45)#17,800 |
| 25. | 53213 | 3.5% | 5.0%(-1.44)#492 | 5.3%(-1.74)#19,005 |
| 26. | 53222 | 3.4% | 5.0%(-1.58)#515 | 5.3%(-1.88)#19,606 |
| 27. | 53226 | 3.3% | 5.0%(-1.71)#539 | 5.3%(-2.01)#20,148 |
| 28. | 53217 | 2.7% | 5.0%(-2.33)#627 | 5.3%(-2.63)#22,578 |
1
Common Questions
What are the Top 10 Zip Codes with the Highest Percentage of Population Employed in Food Preparation & Serving in Milwaukee, WI?
Top 10 Zip Codes with the Highest Percentage of Population Employed in Food Preparation & Serving in Milwaukee, WI are:
What zip code has the Highest Percentage of Population Employed in Food Preparation & Serving in Milwaukee, WI?
53204 has the Highest Percentage of Population Employed in Food Preparation & Serving in Milwaukee, WI with 10.4%.
What is the Percentage of Population Employed in Food Preparation & Serving in Milwaukee, WI?
Percentage of Population Employed in Food Preparation & Serving in Milwaukee is 6.5%.
What is the Percentage of Population Employed in Food Preparation & Serving in Wisconsin?
Percentage of Population Employed in Food Preparation & Serving in Wisconsin is 5.0%.
What is the Percentage of Population Employed in Food Preparation & Serving in the United States?
Percentage of Population Employed in Food Preparation & Serving in the United States is 5.3%.