Zip Codes with the Highest Percentage of Population Employed in Food Preparation & Serving in Wausau, WI
RELATED REPORTS & OPTIONS
Food Preparation & Serving
Wausau
Compare Zip Codes
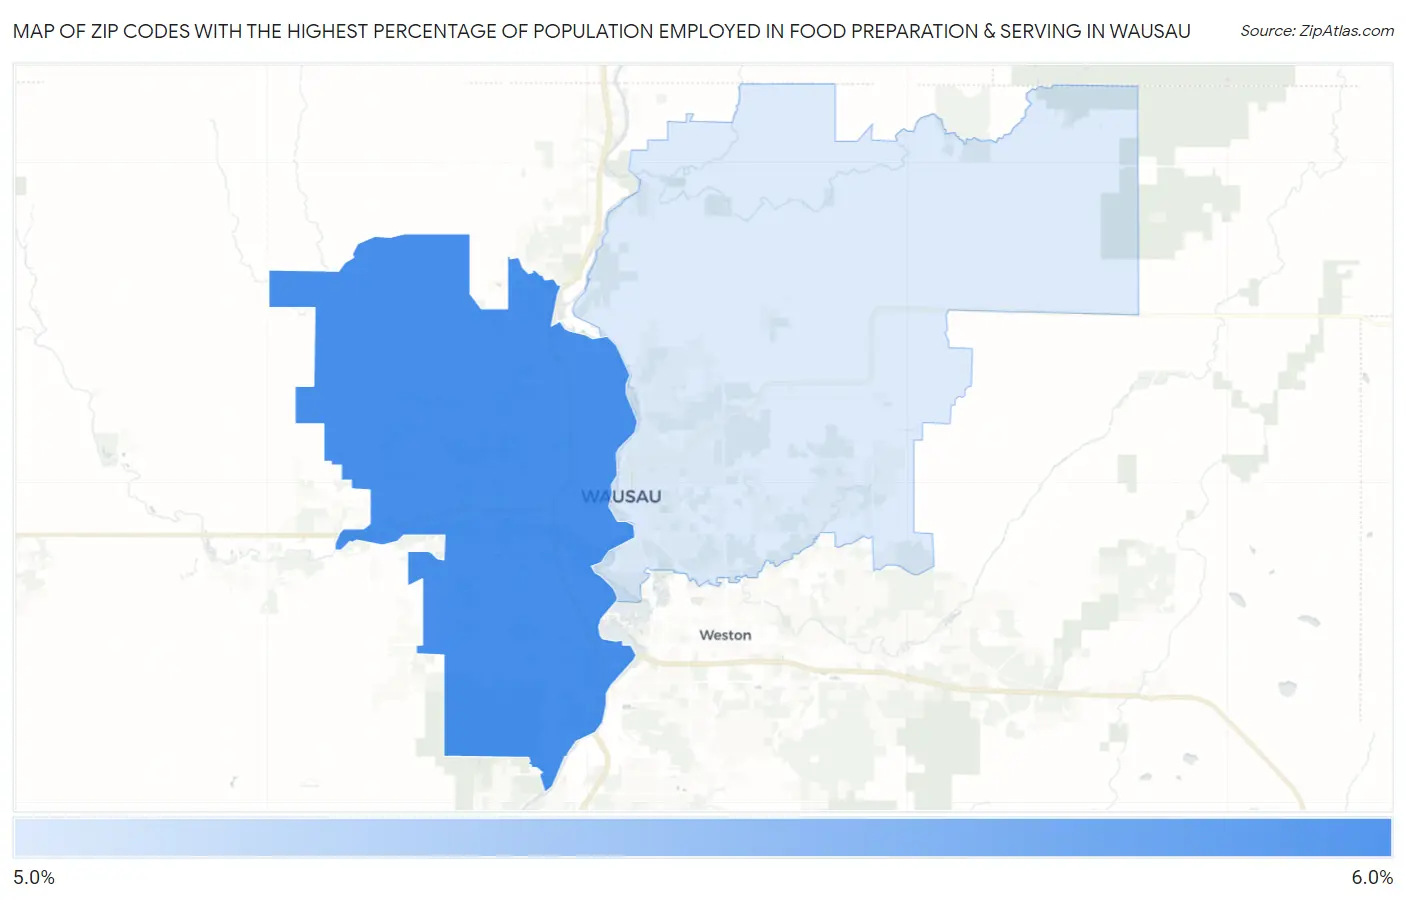
Map of Zip Codes with the Highest Percentage of Population Employed in Food Preparation & Serving in Wausau
5.2%
5.7%
Zip Codes with the Highest Percentage of Population Employed in Food Preparation & Serving in Wausau, WI
| Zip Code | % Employed | vs State | vs National | |
| 1. | 54401 | 5.7% | 5.0%(+0.720)#194 | 5.3%(+0.421)#10,306 |
| 2. | 54403 | 5.2% | 5.0%(+0.255)#246 | 5.3%(-0.044)#11,979 |
1
Common Questions
What are the Top Zip Codes with the Highest Percentage of Population Employed in Food Preparation & Serving in Wausau, WI?
Top Zip Codes with the Highest Percentage of Population Employed in Food Preparation & Serving in Wausau, WI are:
What zip code has the Highest Percentage of Population Employed in Food Preparation & Serving in Wausau, WI?
54401 has the Highest Percentage of Population Employed in Food Preparation & Serving in Wausau, WI with 5.7%.
What is the Percentage of Population Employed in Food Preparation & Serving in Wausau, WI?
Percentage of Population Employed in Food Preparation & Serving in Wausau is 6.8%.
What is the Percentage of Population Employed in Food Preparation & Serving in Wisconsin?
Percentage of Population Employed in Food Preparation & Serving in Wisconsin is 5.0%.
What is the Percentage of Population Employed in Food Preparation & Serving in the United States?
Percentage of Population Employed in Food Preparation & Serving in the United States is 5.3%.