Zip Codes with the Highest Percentage of Population Employed in Food Preparation & Serving in Janesville, WI
RELATED REPORTS & OPTIONS
Food Preparation & Serving
Janesville
Compare Zip Codes
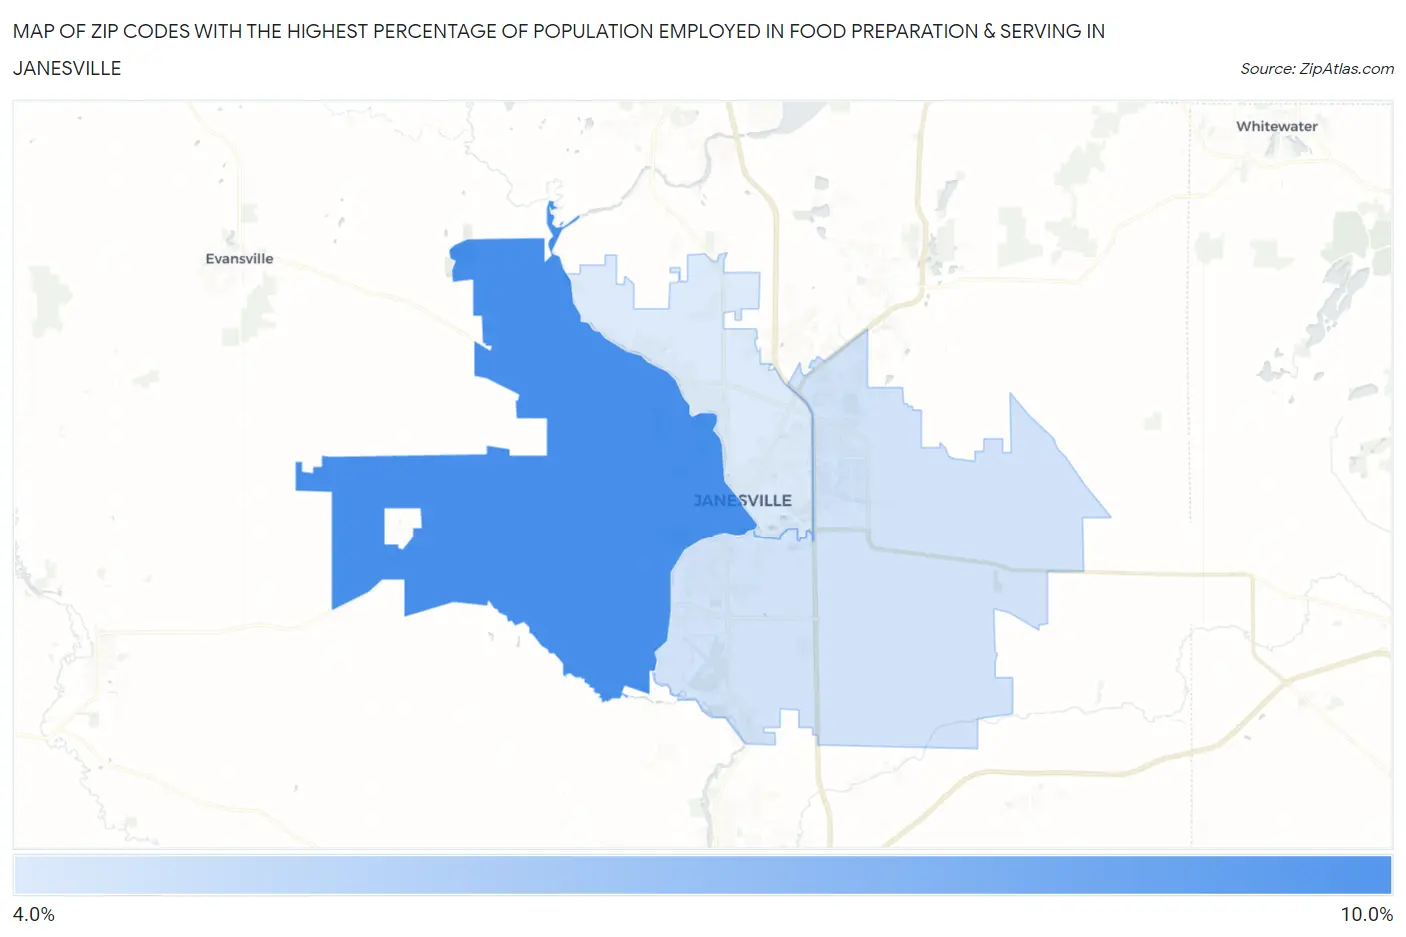
Map of Zip Codes with the Highest Percentage of Population Employed in Food Preparation & Serving in Janesville
4.8%
8.2%
Zip Codes with the Highest Percentage of Population Employed in Food Preparation & Serving in Janesville, WI
| Zip Code | % Employed | vs State | vs National | |
| 1. | 53548 | 8.2% | 5.0%(+3.17)#49 | 5.3%(+2.87)#4,505 |
| 2. | 53546 | 5.1% | 5.0%(+0.110)#265 | 5.3%(-0.189)#12,555 |
| 3. | 53545 | 4.8% | 5.0%(-0.154)#300 | 5.3%(-0.453)#13,630 |
1
Common Questions
What are the Top Zip Codes with the Highest Percentage of Population Employed in Food Preparation & Serving in Janesville, WI?
Top Zip Codes with the Highest Percentage of Population Employed in Food Preparation & Serving in Janesville, WI are:
What zip code has the Highest Percentage of Population Employed in Food Preparation & Serving in Janesville, WI?
53548 has the Highest Percentage of Population Employed in Food Preparation & Serving in Janesville, WI with 8.2%.
What is the Percentage of Population Employed in Food Preparation & Serving in Janesville, WI?
Percentage of Population Employed in Food Preparation & Serving in Janesville is 6.0%.
What is the Percentage of Population Employed in Food Preparation & Serving in Wisconsin?
Percentage of Population Employed in Food Preparation & Serving in Wisconsin is 5.0%.
What is the Percentage of Population Employed in Food Preparation & Serving in the United States?
Percentage of Population Employed in Food Preparation & Serving in the United States is 5.3%.