Zip Codes with the Highest Percentage of Population with a Degree in Computers and Mathematics in Milwaukee, WI

RELATED REPORTS & OPTIONS

Computers and Mathematics
Population
Families and Households
Female Fertility
Female Fertility (Unmarried)
Race (Community Size)
Race (Percentage)
Ancestry (Community Size)
AfricanAlaska NativeAlaskan AthabascanAlbanianAleutAlsatianAmericanApacheArabArgentineanArmenianAssyrian / Chaldean / SyriacAustralianAustrianBahamianBangladeshiBarbadianBelgianBelizeanBhutaneseBlackfeetBolivianBrazilianBritishBritish West IndianBulgarianBurmeseCanadianCape VerdeanCarpatho RusynCelticCentral AmericanCentral American IndianCherokeeCheyenneChickasawChileanChippewaChoctawColombianCosta RicanCreekCroatianCrowCubanCzechCzechoslovakianDanishDominicanDutchEastern EuropeanEcuadorianEgyptianEnglishEstonianEthiopianEuropeanFilipinoFinnishFrenchFrench American IndianFrench CanadianGermanGerman RussianGhanaianGreekGuamanian / ChamorroGuatemalanHaitianHonduranHungarianIcelanderIndian (Asian)IndonesianIranianIraqiIrishIroquoisIsraeliItalianJamaicanJapaneseJordanianKenyanKoreanLaotianLatvianLebaneseLithuanianLuxembourgerMacedonianMalaysianMenomineeMexicanMexican American IndianMongolianMoroccanNative HawaiianNavajoNicaraguanNigerianNorthern EuropeanNorwegianOttawaPakistaniPalestinianPanamanianParaguayanPennsylvania GermanPeruvianPimaPolishPortuguesePotawatomiPuerto RicanRomanianRussianSalvadoranSamoanScandinavianScotch-IrishScottishSeminoleSenegaleseSerbianSiouxSlavicSlovakSloveneSomaliSouth AfricanSouth AmericanSouth American IndianSpaniardSpanishSri LankanSubsaharan AfricanSwedishSwissSyrianThaiTonganTrinidadian and TobagonianTurkishUgandanUkrainianVenezuelanVietnameseWelshWest IndianYugoslavian
Ancestry (Percentage)
AfricanAlaska NativeAlaskan AthabascanAlbanianAleutAlsatianAmericanApacheArabArgentineanArmenianAssyrian / Chaldean / SyriacAustralianAustrianBahamianBangladeshiBarbadianBelgianBelizeanBhutaneseBlackfeetBolivianBrazilianBritishBritish West IndianBulgarianBurmeseCanadianCape VerdeanCarpatho RusynCelticCentral AmericanCentral American IndianCherokeeCheyenneChickasawChileanChippewaChoctawColombianCosta RicanCreekCroatianCrowCubanCzechCzechoslovakianDanishDominicanDutchEastern EuropeanEcuadorianEgyptianEnglishEstonianEthiopianEuropeanFilipinoFinnishFrenchFrench American IndianFrench CanadianGermanGerman RussianGhanaianGreekGuamanian / ChamorroGuatemalanHaitianHonduranHungarianIcelanderIndian (Asian)IndonesianIranianIraqiIrishIroquoisIsraeliItalianJamaicanJapaneseJordanianKenyanKoreanLaotianLatvianLebaneseLithuanianLuxembourgerMacedonianMalaysianMenomineeMexicanMexican American IndianMongolianMoroccanNative HawaiianNavajoNicaraguanNigerianNorthern EuropeanNorwegianOttawaPakistaniPalestinianPanamanianParaguayanPennsylvania GermanPeruvianPimaPolishPortuguesePotawatomiPuerto RicanRomanianRussianSalvadoranSamoanScandinavianScotch-IrishScottishSeminoleSenegaleseSerbianSiouxSlavicSlovakSloveneSomaliSouth AfricanSouth AmericanSouth American IndianSpaniardSpanishSri LankanSubsaharan AfricanSwedishSwissSyrianThaiTonganTrinidadian and TobagonianTurkishUgandanUkrainianVenezuelanVietnameseWelshWest IndianYugoslavian
Immigrant Origin (Total)
AfricaAlbaniaArgentinaAsiaAustraliaAustriaBangladeshBelarusBelgiumBelizeBoliviaBosnia and HerzegovinaBrazilBulgariaBurma / MyanmarCambodiaCameroonCanadaCaribbeanCentral AmericaChileChinaColombiaCongoCosta RicaCroatiaCubaCzechoslovakiaDominicaDominican RepublicEastern AfricaEastern AsiaEastern EuropeEcuadorEgyptEl SalvadorEnglandEritreaEthiopiaEuropeFranceGermanyGhanaGreeceGuatemalaHaitiHondurasHong KongHungaryIndiaIndonesiaIranIraqIrelandIsraelItalyJamaicaJapanJordanKazakhstanKenyaKoreaKuwaitLaosLatin AmericaLatviaLebanonLiberiaLithuaniaMalaysiaMexicoMiddle AfricaMoroccoNepalNetherlandsNicaraguaNigeriaNorthern AfricaNorthern EuropeOceaniaPakistanPanamaPeruPhilippinesPolandRomaniaRussiaSaudi ArabiaScotlandSenegalSerbiaSierra LeoneSingaporeSomaliaSouth AfricaSouth AmericaSouth Central AsiaSouth Eastern AsiaSouthern EuropeSpainSwedenTaiwanThailandTrinidad and TobagoTurkeyUgandaUkraineUzbekistanVenezuelaVietnamWestern AfricaWestern AsiaWestern EuropeZaire
Immigrant Origin (Percentage)
AfricaAlbaniaArgentinaAsiaAustraliaAustriaBangladeshBelarusBelgiumBelizeBoliviaBosnia and HerzegovinaBrazilBulgariaBurma / MyanmarCambodiaCameroonCanadaCaribbeanCentral AmericaChileChinaColombiaCongoCosta RicaCroatiaCubaCzechoslovakiaDominicaDominican RepublicEastern AfricaEastern AsiaEastern EuropeEcuadorEgyptEl SalvadorEnglandEritreaEthiopiaEuropeFranceGermanyGhanaGreeceGuatemalaHaitiHondurasHong KongHungaryIndiaIndonesiaIranIraqIrelandIsraelItalyJamaicaJapanJordanKazakhstanKenyaKoreaKuwaitLaosLatin AmericaLatviaLebanonLiberiaLithuaniaMalaysiaMexicoMiddle AfricaMoroccoNepalNetherlandsNicaraguaNigeriaNorthern AfricaNorthern EuropeOceaniaPakistanPanamaPeruPhilippinesPolandRomaniaRussiaSaudi ArabiaScotlandSenegalSerbiaSierra LeoneSingaporeSomaliaSouth AfricaSouth AmericaSouth Central AsiaSouth Eastern AsiaSouthern EuropeSpainSwedenTaiwanThailandTrinidad and TobagoTurkeyUgandaUkraineUzbekistanVenezuelaVietnamWestern AfricaWestern AsiaWestern EuropeZaire
Income
Income (Families)
Income (Households)
Poverty
Poverty (Families)
Unemployment
Employment Occupations
Employment Industries
Employer Class
Commute Time
Commute Means
School Enrollment
Education by Degree Field
Occupancy
Finances
Physical Characteristics
Milwaukee
Compare Zip Codes
Comparison Subject

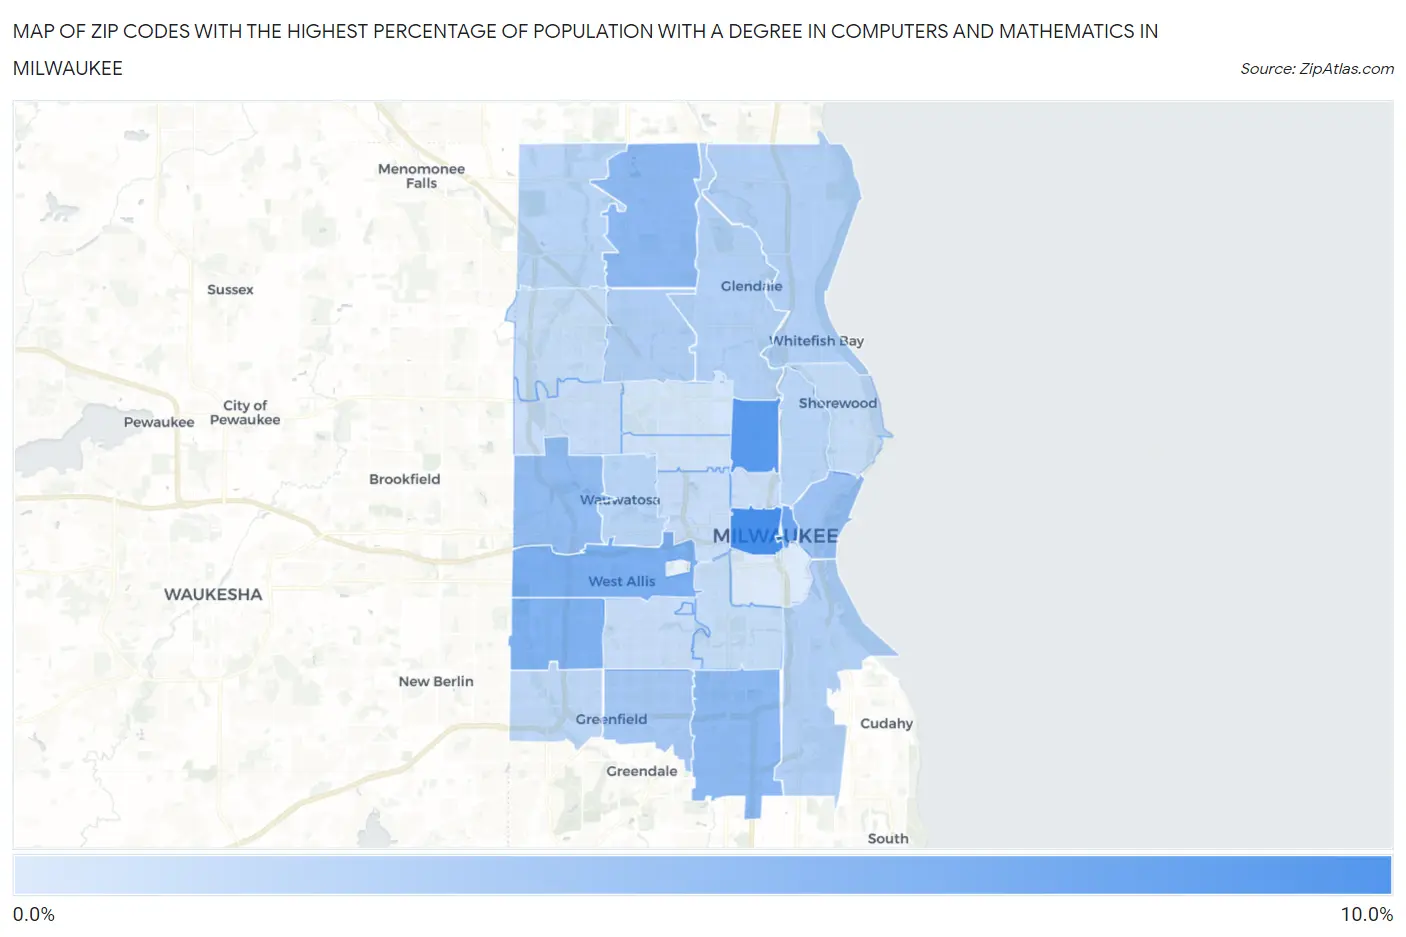
Map of Zip Codes with the Highest Percentage of Population with a Degree in Computers and Mathematics in Milwaukee

0.0%
10.0%
Zip Codes with the Highest Percentage of Population with a Degree in Computers and Mathematics in Milwaukee Map

Zip Codes with the Highest Percentage of Population with a Degree in Computers and Mathematics in Milwaukee, WI

Zip Code % Graduates vs State vs National
1.532339.0%3.9%(+5.08)#204.9%(+4.08)#2,273
2.532068.1%3.9%(+4.22)#314.9%(+3.23)#2,803
3.532037.0%3.9%(+3.11)#504.9%(+2.12)#3,811
4.532146.3%3.9%(+2.43)#594.9%(+1.44)#4,715
5.532276.1%3.9%(+2.24)#694.9%(+1.24)#5,053
6.532235.6%3.9%(+1.68)#844.9%(+0.685)#6,117
7.532215.4%3.9%(+1.53)#934.9%(+0.538)#6,438
8.532265.2%3.9%(+1.26)#1144.9%(+0.267)#7,066
9.532024.8%3.9%(+0.881)#1454.9%(-0.113)#8,048
10.532204.3%3.9%(+0.399)#1804.9%(-0.596)#9,547
11.532183.9%3.9%(-0.049)#2224.9%(-1.04)#10,982
12.532173.6%3.9%(-0.254)#2474.9%(-1.25)#11,717
13.532073.6%3.9%(-0.267)#2504.9%(-1.26)#11,776
14.532093.6%3.9%(-0.296)#2534.9%(-1.29)#11,875
15.532243.3%3.9%(-0.610)#2944.9%(-1.60)#13,050
16.532123.3%3.9%(-0.637)#2954.9%(-1.63)#13,140
17.532133.3%3.9%(-0.639)#2964.9%(-1.63)#13,154
18.532283.0%3.9%(-0.855)#3194.9%(-1.85)#13,923
19.532112.8%3.9%(-1.14)#3654.9%(-2.13)#14,948
20.532252.7%3.9%(-1.16)#3684.9%(-2.15)#15,004
21.532152.7%3.9%(-1.20)#3724.9%(-2.19)#15,167
22.532082.6%3.9%(-1.26)#3764.9%(-2.26)#15,393
23.532192.6%3.9%(-1.29)#3804.9%(-2.28)#15,483
24.532222.6%3.9%(-1.31)#3844.9%(-2.31)#15,582
25.532052.5%3.9%(-1.44)#4044.9%(-2.43)#16,050
26.532102.1%3.9%(-1.76)#4444.9%(-2.76)#17,180
27.532162.1%3.9%(-1.79)#4524.9%(-2.79)#17,269
28.532041.6%3.9%(-2.26)#5104.9%(-3.26)#18,733

Common Questions

What are the Top 10 Zip Codes with the Highest Percentage of Population with a Degree in Computers and Mathematics in Milwaukee, WI?
Top 10 Zip Codes with the Highest Percentage of Population with a Degree in Computers and Mathematics in Milwaukee, WI are:
#1
9.0%
#2
8.1%
#3
7.0%
#4
6.3%
#5
6.1%
#6
5.6%
#7
5.4%
#8
5.2%
#9
4.8%
#10
4.3%
What zip code has the Highest Percentage of Population with a Degree in Computers and Mathematics in Milwaukee, WI?
53233 has the Highest Percentage of Population with a Degree in Computers and Mathematics in Milwaukee, WI with 9.0%.
What is the Percentage of Population with a Degree in Computers and Mathematics in Milwaukee, WI?
Percentage of Population with a Degree in Computers and Mathematics in Milwaukee is 3.7%.
What is the Percentage of Population with a Degree in Computers and Mathematics in Wisconsin?
Percentage of Population with a Degree in Computers and Mathematics in Wisconsin is 3.9%.
What is the Percentage of Population with a Degree in Computers and Mathematics in the United States?
Percentage of Population with a Degree in Computers and Mathematics in the United States is 4.9%.