Zip Codes with the Highest Percentage of Population with a Degree in Liberal Arts and History in Milwaukee, WI

RELATED REPORTS & OPTIONS

Liberal Arts and History
Population
Families and Households
Female Fertility
Female Fertility (Unmarried)
Race (Community Size)
Race (Percentage)
Ancestry (Community Size)
AfricanAlaska NativeAlaskan AthabascanAlbanianAleutAlsatianAmericanApacheArabArgentineanArmenianAssyrian / Chaldean / SyriacAustralianAustrianBahamianBangladeshiBarbadianBelgianBelizeanBhutaneseBlackfeetBolivianBrazilianBritishBritish West IndianBulgarianBurmeseCanadianCape VerdeanCarpatho RusynCelticCentral AmericanCentral American IndianCherokeeCheyenneChickasawChileanChippewaChoctawColombianCosta RicanCreekCroatianCrowCubanCzechCzechoslovakianDanishDominicanDutchEastern EuropeanEcuadorianEgyptianEnglishEstonianEthiopianEuropeanFilipinoFinnishFrenchFrench American IndianFrench CanadianGermanGerman RussianGhanaianGreekGuamanian / ChamorroGuatemalanHaitianHonduranHungarianIcelanderIndian (Asian)IndonesianIranianIraqiIrishIroquoisIsraeliItalianJamaicanJapaneseJordanianKenyanKoreanLaotianLatvianLebaneseLithuanianLuxembourgerMacedonianMalaysianMenomineeMexicanMexican American IndianMongolianMoroccanNative HawaiianNavajoNicaraguanNigerianNorthern EuropeanNorwegianOttawaPakistaniPalestinianPanamanianParaguayanPennsylvania GermanPeruvianPimaPolishPortuguesePotawatomiPuerto RicanRomanianRussianSalvadoranSamoanScandinavianScotch-IrishScottishSeminoleSenegaleseSerbianSiouxSlavicSlovakSloveneSomaliSouth AfricanSouth AmericanSouth American IndianSpaniardSpanishSri LankanSubsaharan AfricanSwedishSwissSyrianThaiTonganTrinidadian and TobagonianTurkishUgandanUkrainianVenezuelanVietnameseWelshWest IndianYugoslavian
Ancestry (Percentage)
AfricanAlaska NativeAlaskan AthabascanAlbanianAleutAlsatianAmericanApacheArabArgentineanArmenianAssyrian / Chaldean / SyriacAustralianAustrianBahamianBangladeshiBarbadianBelgianBelizeanBhutaneseBlackfeetBolivianBrazilianBritishBritish West IndianBulgarianBurmeseCanadianCape VerdeanCarpatho RusynCelticCentral AmericanCentral American IndianCherokeeCheyenneChickasawChileanChippewaChoctawColombianCosta RicanCreekCroatianCrowCubanCzechCzechoslovakianDanishDominicanDutchEastern EuropeanEcuadorianEgyptianEnglishEstonianEthiopianEuropeanFilipinoFinnishFrenchFrench American IndianFrench CanadianGermanGerman RussianGhanaianGreekGuamanian / ChamorroGuatemalanHaitianHonduranHungarianIcelanderIndian (Asian)IndonesianIranianIraqiIrishIroquoisIsraeliItalianJamaicanJapaneseJordanianKenyanKoreanLaotianLatvianLebaneseLithuanianLuxembourgerMacedonianMalaysianMenomineeMexicanMexican American IndianMongolianMoroccanNative HawaiianNavajoNicaraguanNigerianNorthern EuropeanNorwegianOttawaPakistaniPalestinianPanamanianParaguayanPennsylvania GermanPeruvianPimaPolishPortuguesePotawatomiPuerto RicanRomanianRussianSalvadoranSamoanScandinavianScotch-IrishScottishSeminoleSenegaleseSerbianSiouxSlavicSlovakSloveneSomaliSouth AfricanSouth AmericanSouth American IndianSpaniardSpanishSri LankanSubsaharan AfricanSwedishSwissSyrianThaiTonganTrinidadian and TobagonianTurkishUgandanUkrainianVenezuelanVietnameseWelshWest IndianYugoslavian
Immigrant Origin (Total)
AfricaAlbaniaArgentinaAsiaAustraliaAustriaBangladeshBelarusBelgiumBelizeBoliviaBosnia and HerzegovinaBrazilBulgariaBurma / MyanmarCambodiaCameroonCanadaCaribbeanCentral AmericaChileChinaColombiaCongoCosta RicaCroatiaCubaCzechoslovakiaDominicaDominican RepublicEastern AfricaEastern AsiaEastern EuropeEcuadorEgyptEl SalvadorEnglandEritreaEthiopiaEuropeFranceGermanyGhanaGreeceGuatemalaHaitiHondurasHong KongHungaryIndiaIndonesiaIranIraqIrelandIsraelItalyJamaicaJapanJordanKazakhstanKenyaKoreaKuwaitLaosLatin AmericaLatviaLebanonLiberiaLithuaniaMalaysiaMexicoMiddle AfricaMoroccoNepalNetherlandsNicaraguaNigeriaNorthern AfricaNorthern EuropeOceaniaPakistanPanamaPeruPhilippinesPolandRomaniaRussiaSaudi ArabiaScotlandSenegalSerbiaSierra LeoneSingaporeSomaliaSouth AfricaSouth AmericaSouth Central AsiaSouth Eastern AsiaSouthern EuropeSpainSwedenTaiwanThailandTrinidad and TobagoTurkeyUgandaUkraineUzbekistanVenezuelaVietnamWestern AfricaWestern AsiaWestern EuropeZaire
Immigrant Origin (Percentage)
AfricaAlbaniaArgentinaAsiaAustraliaAustriaBangladeshBelarusBelgiumBelizeBoliviaBosnia and HerzegovinaBrazilBulgariaBurma / MyanmarCambodiaCameroonCanadaCaribbeanCentral AmericaChileChinaColombiaCongoCosta RicaCroatiaCubaCzechoslovakiaDominicaDominican RepublicEastern AfricaEastern AsiaEastern EuropeEcuadorEgyptEl SalvadorEnglandEritreaEthiopiaEuropeFranceGermanyGhanaGreeceGuatemalaHaitiHondurasHong KongHungaryIndiaIndonesiaIranIraqIrelandIsraelItalyJamaicaJapanJordanKazakhstanKenyaKoreaKuwaitLaosLatin AmericaLatviaLebanonLiberiaLithuaniaMalaysiaMexicoMiddle AfricaMoroccoNepalNetherlandsNicaraguaNigeriaNorthern AfricaNorthern EuropeOceaniaPakistanPanamaPeruPhilippinesPolandRomaniaRussiaSaudi ArabiaScotlandSenegalSerbiaSierra LeoneSingaporeSomaliaSouth AfricaSouth AmericaSouth Central AsiaSouth Eastern AsiaSouthern EuropeSpainSwedenTaiwanThailandTrinidad and TobagoTurkeyUgandaUkraineUzbekistanVenezuelaVietnamWestern AfricaWestern AsiaWestern EuropeZaire
Income
Income (Families)
Income (Households)
Poverty
Poverty (Families)
Unemployment
Employment Occupations
Employment Industries
Employer Class
Commute Time
Commute Means
School Enrollment
Education by Degree Field
Occupancy
Finances
Physical Characteristics
Milwaukee
Compare Zip Codes
Comparison Subject

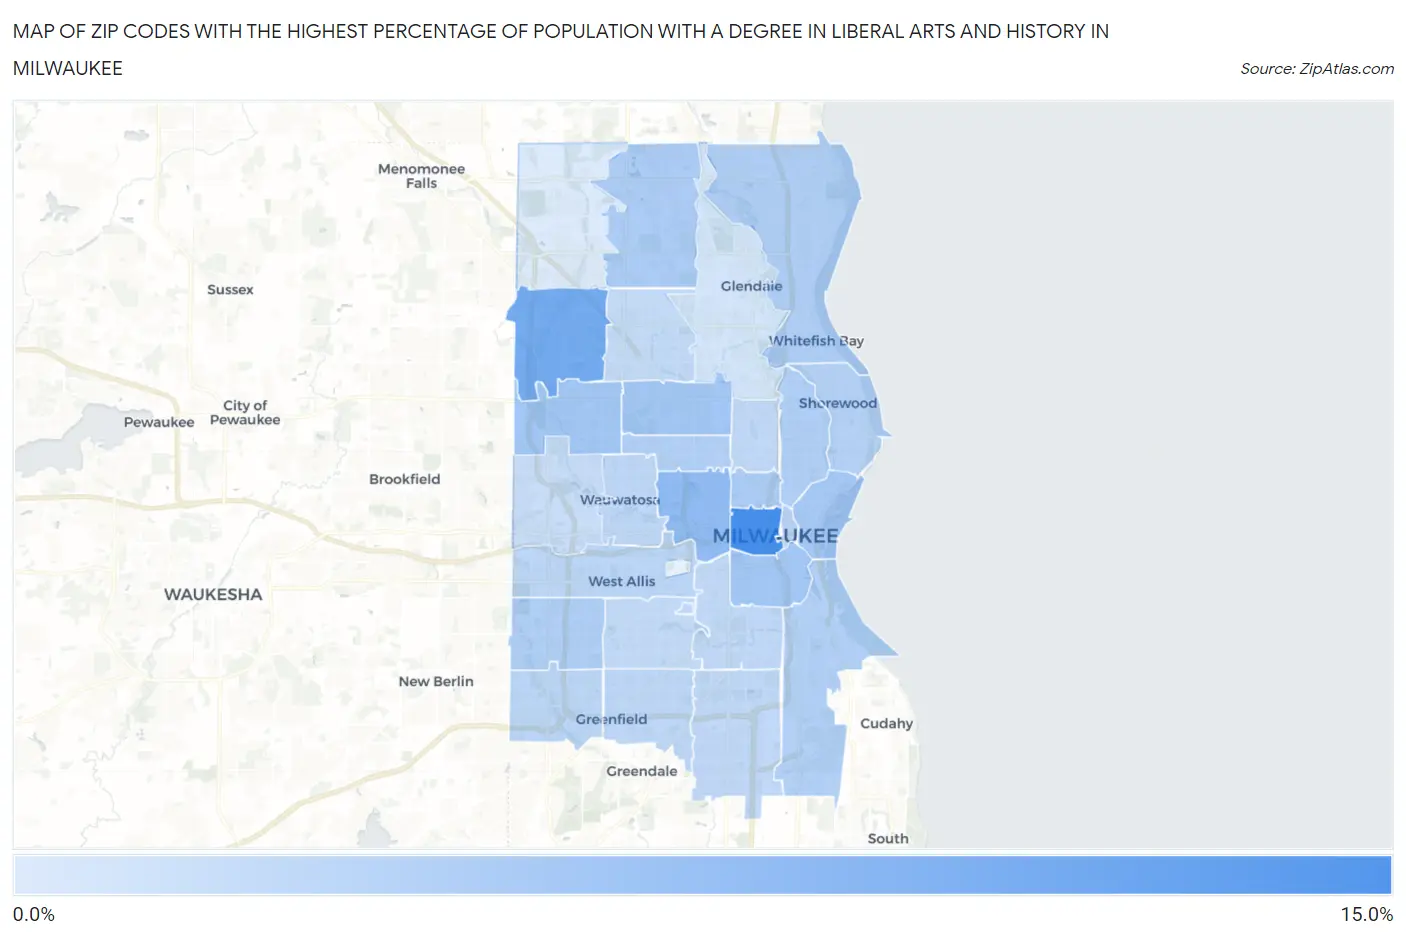
Map of Zip Codes with the Highest Percentage of Population with a Degree in Liberal Arts and History in Milwaukee

0.0%
15.0%
Zip Codes with the Highest Percentage of Population with a Degree in Liberal Arts and History in Milwaukee Map

Zip Codes with the Highest Percentage of Population with a Degree in Liberal Arts and History in Milwaukee, WI

Zip Code % Graduates vs State vs National
1.5323314.3%4.0%(+10.3)#94.9%(+9.44)#1,555
2.5322510.3%4.0%(+6.25)#244.9%(+5.41)#2,946
3.532087.8%4.0%(+3.79)#504.9%(+2.94)#5,154
4.532046.4%4.0%(+2.33)#884.9%(+1.49)#7,651
5.532226.2%4.0%(+2.21)#974.9%(+1.36)#7,946
6.532166.2%4.0%(+2.18)#1004.9%(+1.33)#8,017
7.532026.2%4.0%(+2.15)#1024.9%(+1.30)#8,077
8.532055.6%4.0%(+1.57)#1324.9%(+0.727)#9,573
9.532235.4%4.0%(+1.40)#1454.9%(+0.557)#10,065
10.532175.4%4.0%(+1.38)#1484.9%(+0.538)#10,107
11.532275.1%4.0%(+1.12)#1724.9%(+0.269)#10,897
12.532125.1%4.0%(+1.11)#1734.9%(+0.268)#10,900
13.532104.9%4.0%(+0.906)#1944.9%(+0.059)#11,552
14.532074.9%4.0%(+0.900)#1964.9%(+0.054)#11,570
15.532114.8%4.0%(+0.728)#2074.9%(-0.119)#12,147
16.532034.6%4.0%(+0.596)#2184.9%(-0.250)#12,580
17.532144.2%4.0%(+0.223)#2514.9%(-0.623)#13,824
18.532284.1%4.0%(+0.087)#2624.9%(-0.759)#14,352
19.532134.1%4.0%(+0.051)#2674.9%(-0.795)#14,485
20.532203.9%4.0%(-0.097)#2904.9%(-0.943)#15,057
21.532063.8%4.0%(-0.244)#3174.9%(-1.09)#15,592
22.532153.8%4.0%(-0.275)#3214.9%(-1.12)#15,695
23.532213.7%4.0%(-0.288)#3254.9%(-1.13)#15,755
24.532193.7%4.0%(-0.327)#3294.9%(-1.17)#15,911
25.532183.6%4.0%(-0.421)#3414.9%(-1.27)#16,236
26.532263.3%4.0%(-0.709)#3744.9%(-1.56)#17,261
27.532092.3%4.0%(-1.71)#5174.9%(-2.56)#20,523
28.532241.6%4.0%(-2.47)#5954.9%(-3.32)#22,401

Common Questions

What are the Top 10 Zip Codes with the Highest Percentage of Population with a Degree in Liberal Arts and History in Milwaukee, WI?
Top 10 Zip Codes with the Highest Percentage of Population with a Degree in Liberal Arts and History in Milwaukee, WI are:
#1
14.3%
#2
10.3%
#3
7.8%
#4
6.4%
#5
6.2%
#6
6.2%
#7
6.2%
#8
5.6%
#9
5.4%
#10
5.4%
What zip code has the Highest Percentage of Population with a Degree in Liberal Arts and History in Milwaukee, WI?
53233 has the Highest Percentage of Population with a Degree in Liberal Arts and History in Milwaukee, WI with 14.3%.
What is the Percentage of Population with a Degree in Liberal Arts and History in Milwaukee, WI?
Percentage of Population with a Degree in Liberal Arts and History in Milwaukee is 5.1%.
What is the Percentage of Population with a Degree in Liberal Arts and History in Wisconsin?
Percentage of Population with a Degree in Liberal Arts and History in Wisconsin is 4.0%.
What is the Percentage of Population with a Degree in Liberal Arts and History in the United States?
Percentage of Population with a Degree in Liberal Arts and History in the United States is 4.9%.