Zip Codes with the Highest Percentage of Population Employed in Food Preparation & Serving in West Bend, WI
RELATED REPORTS & OPTIONS
Food Preparation & Serving
West Bend
Compare Zip Codes
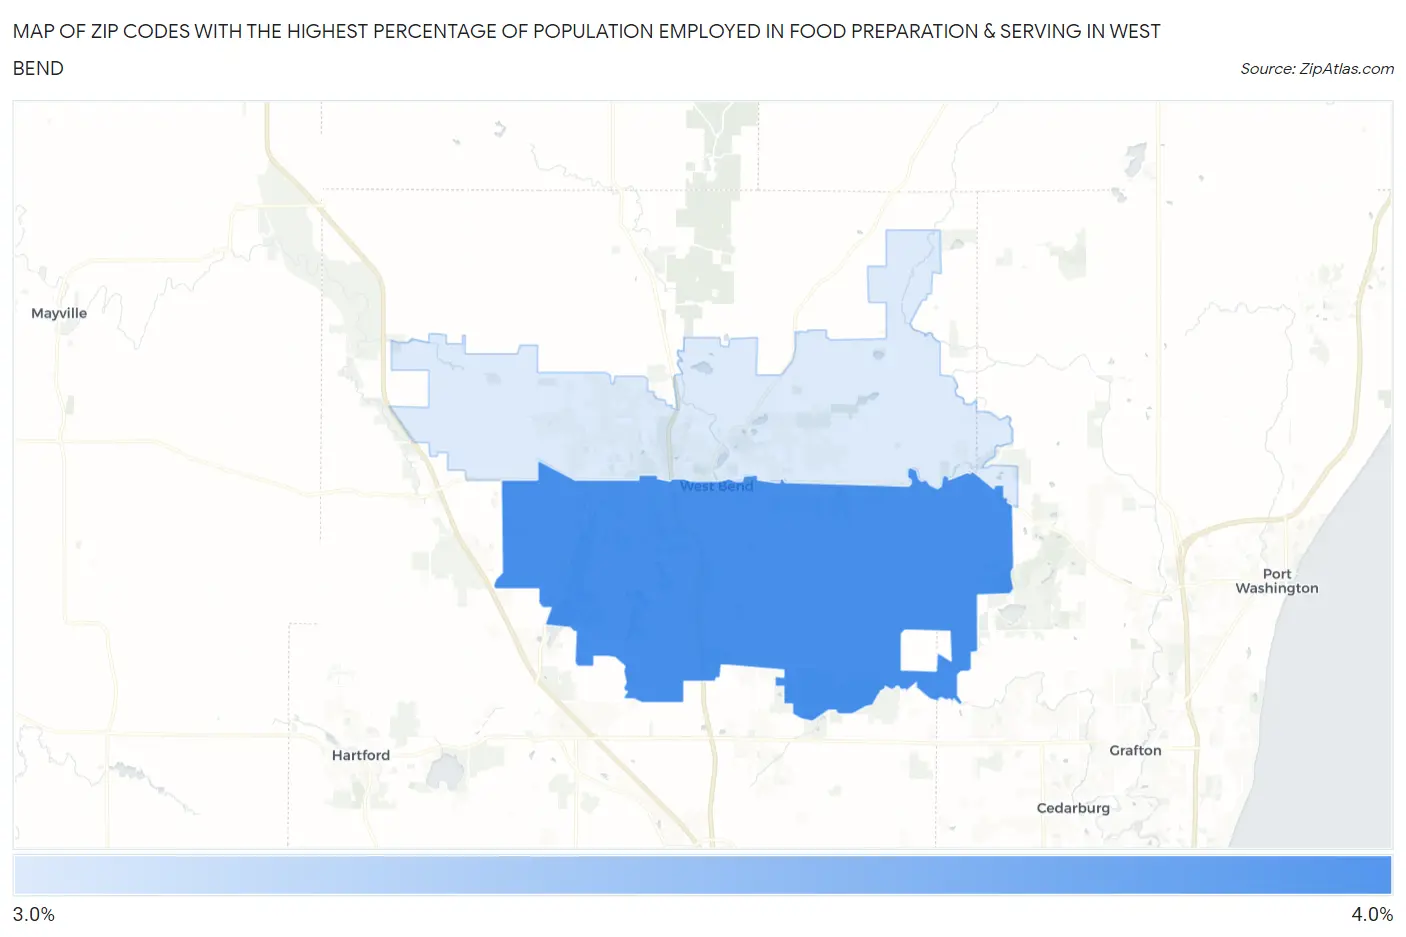
Map of Zip Codes with the Highest Percentage of Population Employed in Food Preparation & Serving in West Bend
3.3%
3.5%
Zip Codes with the Highest Percentage of Population Employed in Food Preparation & Serving in West Bend, WI
| Zip Code | % Employed | vs State | vs National | |
| 1. | 53095 | 3.5% | 5.0%(-1.50)#503 | 5.3%(-1.80)#19,246 |
| 2. | 53090 | 3.3% | 5.0%(-1.66)#530 | 5.3%(-1.96)#19,942 |
1
Common Questions
What are the Top Zip Codes with the Highest Percentage of Population Employed in Food Preparation & Serving in West Bend, WI?
Top Zip Codes with the Highest Percentage of Population Employed in Food Preparation & Serving in West Bend, WI are:
What zip code has the Highest Percentage of Population Employed in Food Preparation & Serving in West Bend, WI?
53095 has the Highest Percentage of Population Employed in Food Preparation & Serving in West Bend, WI with 3.5%.
What is the Percentage of Population Employed in Food Preparation & Serving in West Bend, WI?
Percentage of Population Employed in Food Preparation & Serving in West Bend is 3.2%.
What is the Percentage of Population Employed in Food Preparation & Serving in Wisconsin?
Percentage of Population Employed in Food Preparation & Serving in Wisconsin is 5.0%.
What is the Percentage of Population Employed in Food Preparation & Serving in the United States?
Percentage of Population Employed in Food Preparation & Serving in the United States is 5.3%.