Zip Codes with the Highest Percentage of Population Employed in Food Preparation & Serving in New Berlin, WI
RELATED REPORTS & OPTIONS
Food Preparation & Serving
New Berlin
Compare Zip Codes
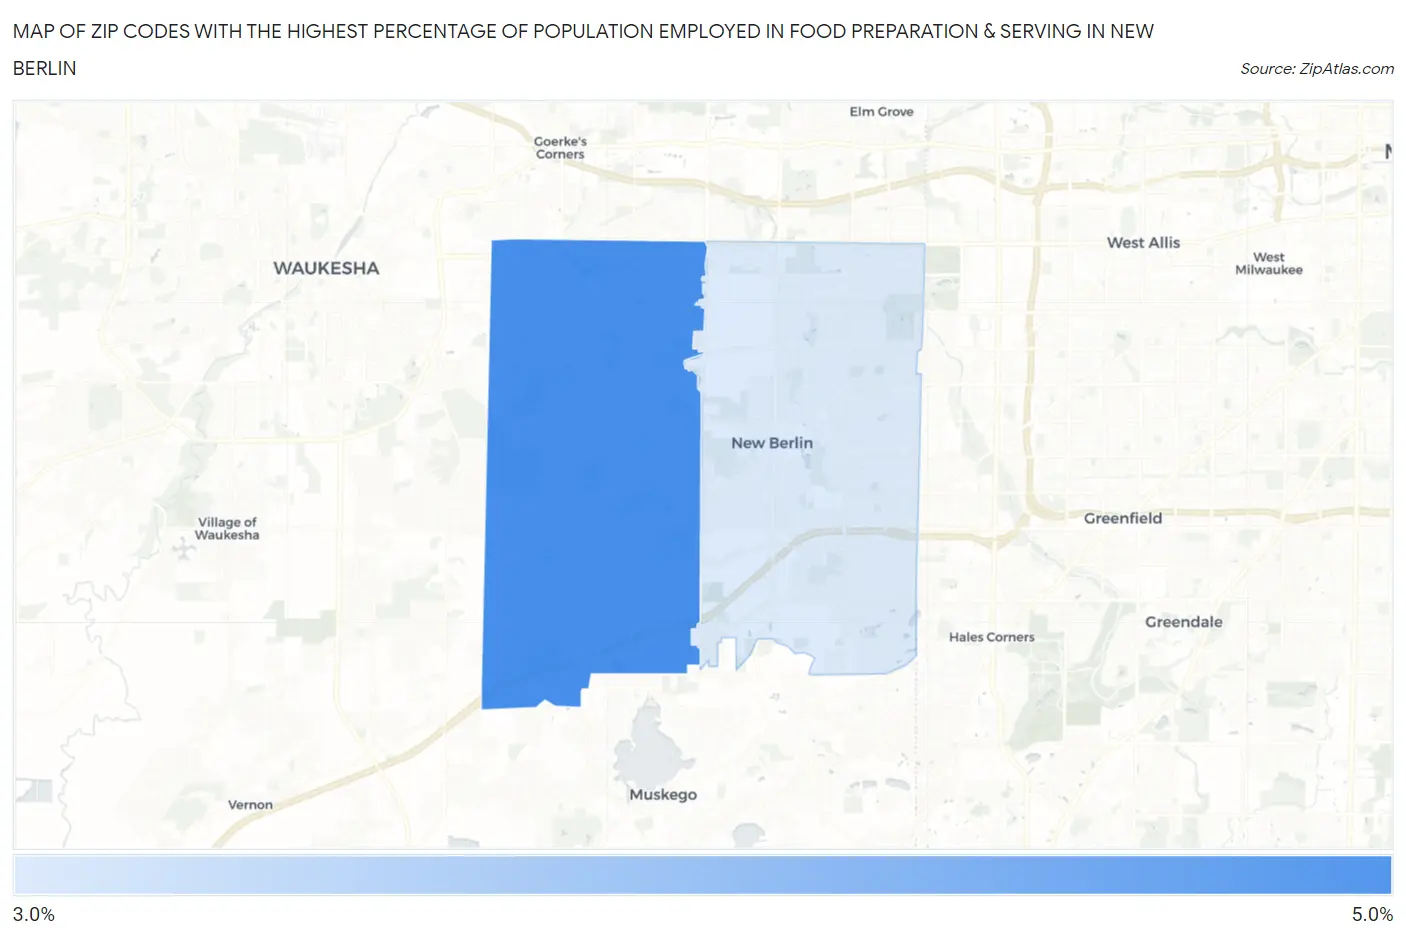
Map of Zip Codes with the Highest Percentage of Population Employed in Food Preparation & Serving in New Berlin
3.5%
4.3%
Zip Codes with the Highest Percentage of Population Employed in Food Preparation & Serving in New Berlin, WI
| Zip Code | % Employed | vs State | vs National | |
| 1. | 53146 | 4.3% | 5.0%(-0.660)#367 | 5.3%(-0.959)#15,754 |
| 2. | 53151 | 3.5% | 5.0%(-1.48)#496 | 5.3%(-1.77)#19,150 |
1
Common Questions
What are the Top Zip Codes with the Highest Percentage of Population Employed in Food Preparation & Serving in New Berlin, WI?
Top Zip Codes with the Highest Percentage of Population Employed in Food Preparation & Serving in New Berlin, WI are:
What zip code has the Highest Percentage of Population Employed in Food Preparation & Serving in New Berlin, WI?
53146 has the Highest Percentage of Population Employed in Food Preparation & Serving in New Berlin, WI with 4.3%.
What is the Percentage of Population Employed in Food Preparation & Serving in New Berlin, WI?
Percentage of Population Employed in Food Preparation & Serving in New Berlin is 3.6%.
What is the Percentage of Population Employed in Food Preparation & Serving in Wisconsin?
Percentage of Population Employed in Food Preparation & Serving in Wisconsin is 5.0%.
What is the Percentage of Population Employed in Food Preparation & Serving in the United States?
Percentage of Population Employed in Food Preparation & Serving in the United States is 5.3%.