Zip Codes with the Highest Percentage of Population Employed in Food Preparation & Serving in Fond Du Lac, WI
RELATED REPORTS & OPTIONS
Food Preparation & Serving
Fond Du Lac
Compare Zip Codes
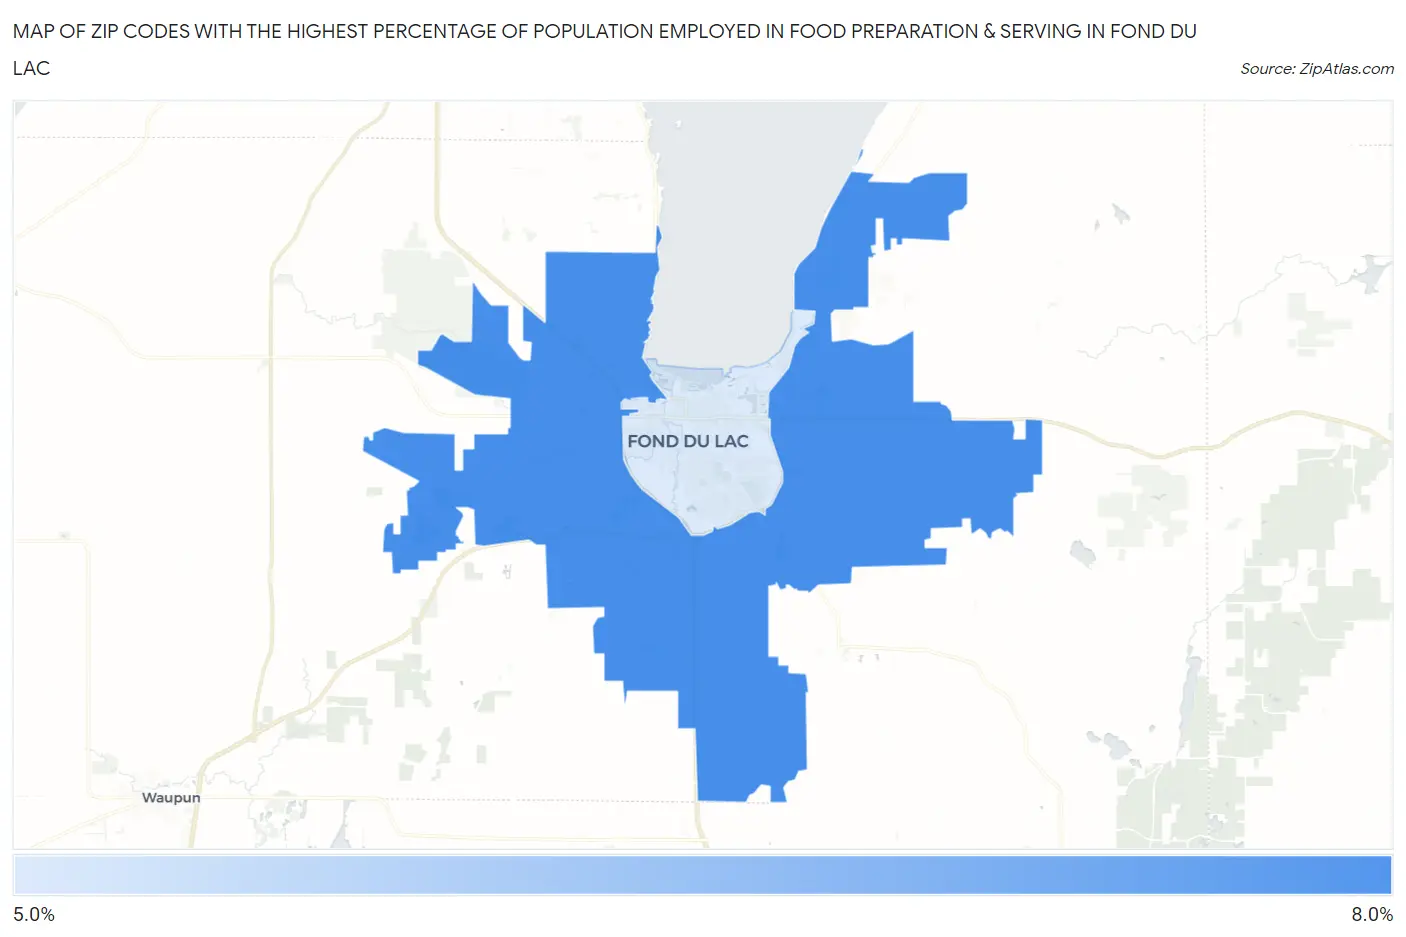
Map of Zip Codes with the Highest Percentage of Population Employed in Food Preparation & Serving in Fond Du Lac
5.2%
7.1%
Zip Codes with the Highest Percentage of Population Employed in Food Preparation & Serving in Fond Du Lac, WI
| Zip Code | % Employed | vs State | vs National | |
| 1. | 54937 | 7.1% | 5.0%(+2.14)#91 | 5.3%(+1.84)#6,278 |
| 2. | 54935 | 5.2% | 5.0%(+0.185)#254 | 5.3%(-0.114)#12,271 |
1
Common Questions
What are the Top Zip Codes with the Highest Percentage of Population Employed in Food Preparation & Serving in Fond Du Lac, WI?
Top Zip Codes with the Highest Percentage of Population Employed in Food Preparation & Serving in Fond Du Lac, WI are:
What zip code has the Highest Percentage of Population Employed in Food Preparation & Serving in Fond Du Lac, WI?
54937 has the Highest Percentage of Population Employed in Food Preparation & Serving in Fond Du Lac, WI with 7.1%.
What is the Percentage of Population Employed in Food Preparation & Serving in Fond Du Lac, WI?
Percentage of Population Employed in Food Preparation & Serving in Fond Du Lac is 5.6%.
What is the Percentage of Population Employed in Food Preparation & Serving in Wisconsin?
Percentage of Population Employed in Food Preparation & Serving in Wisconsin is 5.0%.
What is the Percentage of Population Employed in Food Preparation & Serving in the United States?
Percentage of Population Employed in Food Preparation & Serving in the United States is 5.3%.