Zip Codes with the Highest Percentage of Population with a Degree in Literature and Languages in Milwaukee, WI

RELATED REPORTS & OPTIONS

Literature and Languages
Population
Families and Households
Female Fertility
Female Fertility (Unmarried)
Race (Community Size)
Race (Percentage)
Ancestry (Community Size)
AfricanAlaska NativeAlaskan AthabascanAlbanianAleutAlsatianAmericanApacheArabArgentineanArmenianAssyrian / Chaldean / SyriacAustralianAustrianBahamianBangladeshiBarbadianBelgianBelizeanBhutaneseBlackfeetBolivianBrazilianBritishBritish West IndianBulgarianBurmeseCanadianCape VerdeanCarpatho RusynCelticCentral AmericanCentral American IndianCherokeeCheyenneChickasawChileanChippewaChoctawColombianCosta RicanCreekCroatianCrowCubanCzechCzechoslovakianDanishDominicanDutchEastern EuropeanEcuadorianEgyptianEnglishEstonianEthiopianEuropeanFilipinoFinnishFrenchFrench American IndianFrench CanadianGermanGerman RussianGhanaianGreekGuamanian / ChamorroGuatemalanHaitianHonduranHungarianIcelanderIndian (Asian)IndonesianIranianIraqiIrishIroquoisIsraeliItalianJamaicanJapaneseJordanianKenyanKoreanLaotianLatvianLebaneseLithuanianLuxembourgerMacedonianMalaysianMenomineeMexicanMexican American IndianMongolianMoroccanNative HawaiianNavajoNicaraguanNigerianNorthern EuropeanNorwegianOttawaPakistaniPalestinianPanamanianParaguayanPennsylvania GermanPeruvianPimaPolishPortuguesePotawatomiPuerto RicanRomanianRussianSalvadoranSamoanScandinavianScotch-IrishScottishSeminoleSenegaleseSerbianSiouxSlavicSlovakSloveneSomaliSouth AfricanSouth AmericanSouth American IndianSpaniardSpanishSri LankanSubsaharan AfricanSwedishSwissSyrianThaiTonganTrinidadian and TobagonianTurkishUgandanUkrainianVenezuelanVietnameseWelshWest IndianYugoslavian
Ancestry (Percentage)
AfricanAlaska NativeAlaskan AthabascanAlbanianAleutAlsatianAmericanApacheArabArgentineanArmenianAssyrian / Chaldean / SyriacAustralianAustrianBahamianBangladeshiBarbadianBelgianBelizeanBhutaneseBlackfeetBolivianBrazilianBritishBritish West IndianBulgarianBurmeseCanadianCape VerdeanCarpatho RusynCelticCentral AmericanCentral American IndianCherokeeCheyenneChickasawChileanChippewaChoctawColombianCosta RicanCreekCroatianCrowCubanCzechCzechoslovakianDanishDominicanDutchEastern EuropeanEcuadorianEgyptianEnglishEstonianEthiopianEuropeanFilipinoFinnishFrenchFrench American IndianFrench CanadianGermanGerman RussianGhanaianGreekGuamanian / ChamorroGuatemalanHaitianHonduranHungarianIcelanderIndian (Asian)IndonesianIranianIraqiIrishIroquoisIsraeliItalianJamaicanJapaneseJordanianKenyanKoreanLaotianLatvianLebaneseLithuanianLuxembourgerMacedonianMalaysianMenomineeMexicanMexican American IndianMongolianMoroccanNative HawaiianNavajoNicaraguanNigerianNorthern EuropeanNorwegianOttawaPakistaniPalestinianPanamanianParaguayanPennsylvania GermanPeruvianPimaPolishPortuguesePotawatomiPuerto RicanRomanianRussianSalvadoranSamoanScandinavianScotch-IrishScottishSeminoleSenegaleseSerbianSiouxSlavicSlovakSloveneSomaliSouth AfricanSouth AmericanSouth American IndianSpaniardSpanishSri LankanSubsaharan AfricanSwedishSwissSyrianThaiTonganTrinidadian and TobagonianTurkishUgandanUkrainianVenezuelanVietnameseWelshWest IndianYugoslavian
Immigrant Origin (Total)
AfricaAlbaniaArgentinaAsiaAustraliaAustriaBangladeshBelarusBelgiumBelizeBoliviaBosnia and HerzegovinaBrazilBulgariaBurma / MyanmarCambodiaCameroonCanadaCaribbeanCentral AmericaChileChinaColombiaCongoCosta RicaCroatiaCubaCzechoslovakiaDominicaDominican RepublicEastern AfricaEastern AsiaEastern EuropeEcuadorEgyptEl SalvadorEnglandEritreaEthiopiaEuropeFranceGermanyGhanaGreeceGuatemalaHaitiHondurasHong KongHungaryIndiaIndonesiaIranIraqIrelandIsraelItalyJamaicaJapanJordanKazakhstanKenyaKoreaKuwaitLaosLatin AmericaLatviaLebanonLiberiaLithuaniaMalaysiaMexicoMiddle AfricaMoroccoNepalNetherlandsNicaraguaNigeriaNorthern AfricaNorthern EuropeOceaniaPakistanPanamaPeruPhilippinesPolandRomaniaRussiaSaudi ArabiaScotlandSenegalSerbiaSierra LeoneSingaporeSomaliaSouth AfricaSouth AmericaSouth Central AsiaSouth Eastern AsiaSouthern EuropeSpainSwedenTaiwanThailandTrinidad and TobagoTurkeyUgandaUkraineUzbekistanVenezuelaVietnamWestern AfricaWestern AsiaWestern EuropeZaire
Immigrant Origin (Percentage)
AfricaAlbaniaArgentinaAsiaAustraliaAustriaBangladeshBelarusBelgiumBelizeBoliviaBosnia and HerzegovinaBrazilBulgariaBurma / MyanmarCambodiaCameroonCanadaCaribbeanCentral AmericaChileChinaColombiaCongoCosta RicaCroatiaCubaCzechoslovakiaDominicaDominican RepublicEastern AfricaEastern AsiaEastern EuropeEcuadorEgyptEl SalvadorEnglandEritreaEthiopiaEuropeFranceGermanyGhanaGreeceGuatemalaHaitiHondurasHong KongHungaryIndiaIndonesiaIranIraqIrelandIsraelItalyJamaicaJapanJordanKazakhstanKenyaKoreaKuwaitLaosLatin AmericaLatviaLebanonLiberiaLithuaniaMalaysiaMexicoMiddle AfricaMoroccoNepalNetherlandsNicaraguaNigeriaNorthern AfricaNorthern EuropeOceaniaPakistanPanamaPeruPhilippinesPolandRomaniaRussiaSaudi ArabiaScotlandSenegalSerbiaSierra LeoneSingaporeSomaliaSouth AfricaSouth AmericaSouth Central AsiaSouth Eastern AsiaSouthern EuropeSpainSwedenTaiwanThailandTrinidad and TobagoTurkeyUgandaUkraineUzbekistanVenezuelaVietnamWestern AfricaWestern AsiaWestern EuropeZaire
Income
Income (Families)
Income (Households)
Poverty
Poverty (Families)
Unemployment
Employment Occupations
Employment Industries
Employer Class
Commute Time
Commute Means
School Enrollment
Education by Degree Field
Occupancy
Finances
Physical Characteristics
Milwaukee
Compare Zip Codes
Comparison Subject

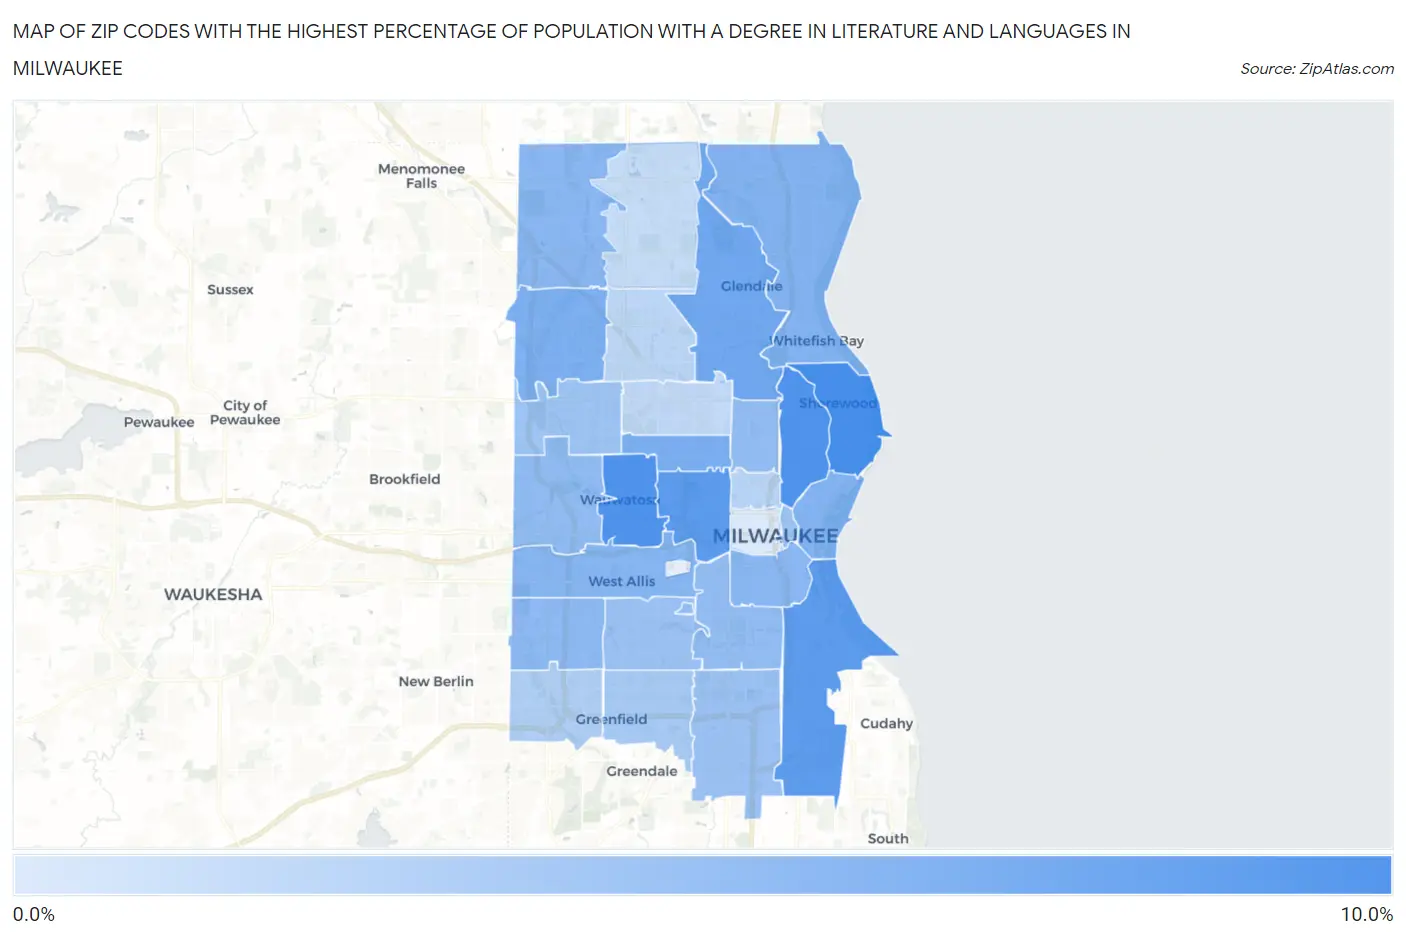
Map of Zip Codes with the Highest Percentage of Population with a Degree in Literature and Languages in Milwaukee

0.0%
10.0%
Zip Codes with the Highest Percentage of Population with a Degree in Literature and Languages in Milwaukee Map

Zip Codes with the Highest Percentage of Population with a Degree in Literature and Languages in Milwaukee, WI

Zip Code % Graduates vs State vs National
1.532118.2%4.0%(+4.27)#344.4%(+3.83)#2,791
2.532137.9%4.0%(+3.89)#384.4%(+3.44)#3,102
3.532127.8%4.0%(+3.80)#434.4%(+3.35)#3,192
4.532087.2%4.0%(+3.21)#534.4%(+2.77)#3,777
5.532077.1%4.0%(+3.10)#584.4%(+2.66)#3,925
6.532096.1%4.0%(+2.18)#834.4%(+1.73)#5,189
7.532105.5%4.0%(+1.57)#1064.4%(+1.12)#6,262
8.532255.5%4.0%(+1.50)#1094.4%(+1.05)#6,397
9.532025.3%4.0%(+1.29)#1174.4%(+0.846)#6,837
10.532175.2%4.0%(+1.23)#1194.4%(+0.781)#6,969
11.532144.9%4.0%(+0.964)#1254.4%(+0.519)#7,532
12.532044.9%4.0%(+0.921)#1314.4%(+0.476)#7,659
13.532244.9%4.0%(+0.908)#1334.4%(+0.463)#7,696
14.532274.7%4.0%(+0.696)#1464.4%(+0.251)#8,259
15.532264.5%4.0%(+0.500)#1604.4%(+0.056)#8,808
16.532064.4%4.0%(+0.485)#1614.4%(+0.040)#8,862
17.532154.4%4.0%(+0.389)#1674.4%(-0.056)#9,136
18.532214.1%4.0%(+0.135)#1914.4%(-0.310)#9,914
19.532194.0%4.0%(+0.039)#1994.4%(-0.406)#10,159
20.532223.9%4.0%(-0.099)#2144.4%(-0.544)#10,612
21.532033.9%4.0%(-0.113)#2154.4%(-0.558)#10,662
22.532203.4%4.0%(-0.571)#2724.4%(-1.02)#12,205
23.532282.9%4.0%(-1.06)#3234.4%(-1.50)#13,879
24.532052.5%4.0%(-1.50)#3884.4%(-1.95)#15,456
25.532182.4%4.0%(-1.59)#3994.4%(-2.03)#15,756
26.532162.1%4.0%(-1.86)#4344.4%(-2.30)#16,701
27.532231.9%4.0%(-2.03)#4644.4%(-2.48)#17,312
28.532330.80%4.0%(-3.16)#5974.4%(-3.61)#20,622

Common Questions

What are the Top 10 Zip Codes with the Highest Percentage of Population with a Degree in Literature and Languages in Milwaukee, WI?
Top 10 Zip Codes with the Highest Percentage of Population with a Degree in Literature and Languages in Milwaukee, WI are:
#1
8.2%
#2
7.9%
#3
7.8%
#4
7.2%
#5
7.1%
#6
6.1%
#7
5.5%
#8
5.5%
#9
5.3%
#10
5.2%
What zip code has the Highest Percentage of Population with a Degree in Literature and Languages in Milwaukee, WI?
53211 has the Highest Percentage of Population with a Degree in Literature and Languages in Milwaukee, WI with 8.2%.
What is the Percentage of Population with a Degree in Literature and Languages in Milwaukee, WI?
Percentage of Population with a Degree in Literature and Languages in Milwaukee is 5.3%.
What is the Percentage of Population with a Degree in Literature and Languages in Wisconsin?
Percentage of Population with a Degree in Literature and Languages in Wisconsin is 4.0%.
What is the Percentage of Population with a Degree in Literature and Languages in the United States?
Percentage of Population with a Degree in Literature and Languages in the United States is 4.4%.