Zip Codes with the Highest Percentage of Population Employed in Food Preparation & Serving in Green Bay, WI
RELATED REPORTS & OPTIONS
Food Preparation & Serving
Green Bay
Compare Zip Codes
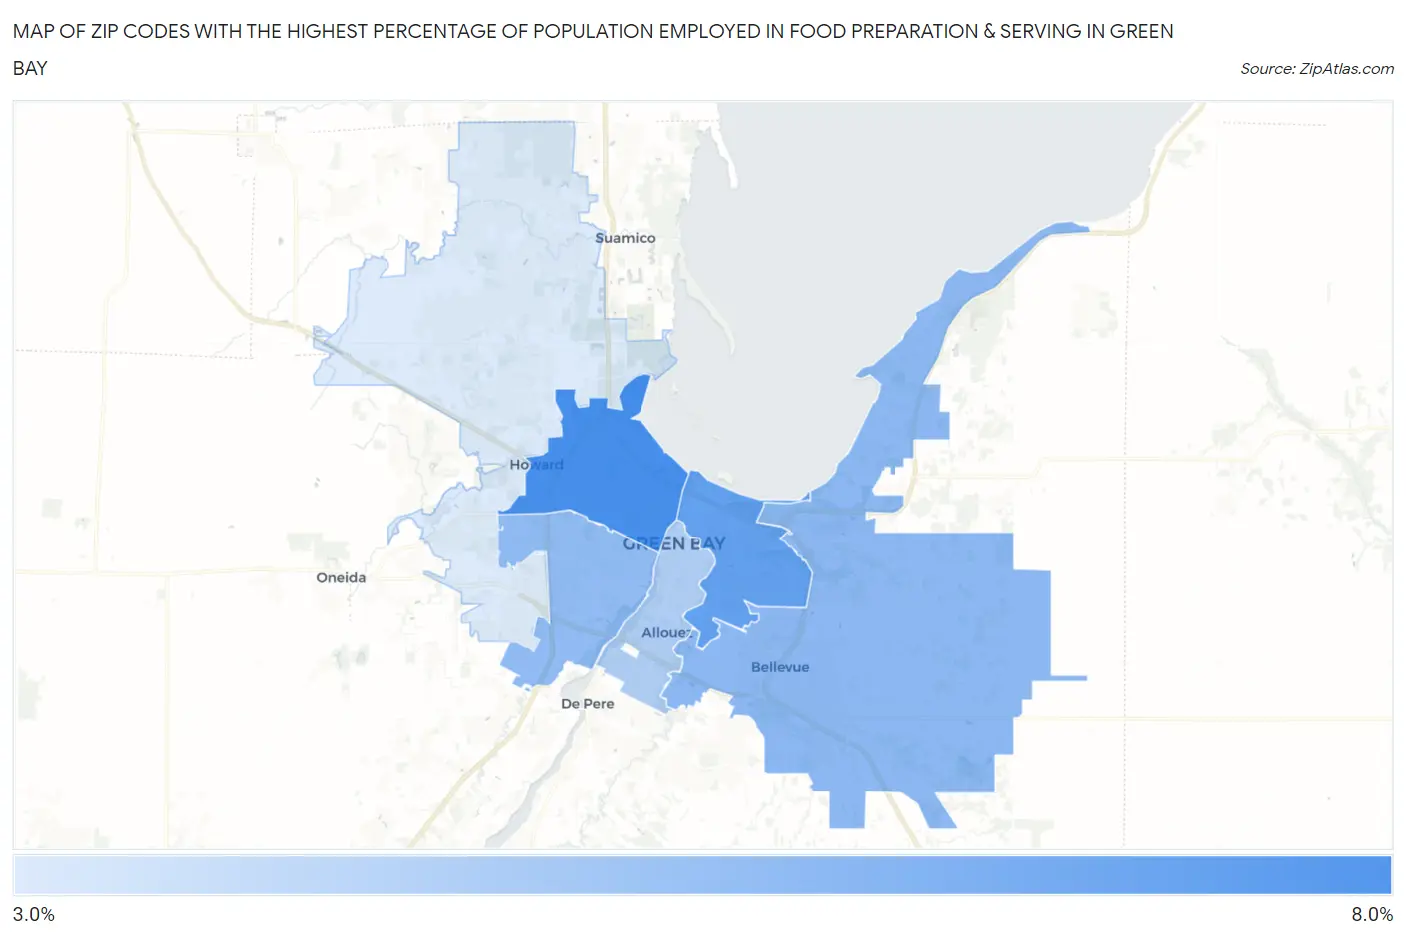
Map of Zip Codes with the Highest Percentage of Population Employed in Food Preparation & Serving in Green Bay
3.9%
7.3%
Zip Codes with the Highest Percentage of Population Employed in Food Preparation & Serving in Green Bay, WI
| Zip Code | % Employed | vs State | vs National | |
| 1. | 54303 | 7.3% | 5.0%(+2.36)#79 | 5.3%(+2.06)#5,853 |
| 2. | 54302 | 6.7% | 5.0%(+1.71)#116 | 5.3%(+1.41)#7,354 |
| 3. | 54311 | 5.7% | 5.0%(+0.747)#191 | 5.3%(+0.449)#10,231 |
| 4. | 54304 | 5.6% | 5.0%(+0.659)#203 | 5.3%(+0.360)#10,538 |
| 5. | 54301 | 4.9% | 5.0%(-0.053)#288 | 5.3%(-0.352)#13,211 |
| 6. | 54313 | 3.9% | 5.0%(-1.09)#440 | 5.3%(-1.39)#17,543 |
1
Common Questions
What are the Top 5 Zip Codes with the Highest Percentage of Population Employed in Food Preparation & Serving in Green Bay, WI?
Top 5 Zip Codes with the Highest Percentage of Population Employed in Food Preparation & Serving in Green Bay, WI are:
What zip code has the Highest Percentage of Population Employed in Food Preparation & Serving in Green Bay, WI?
54303 has the Highest Percentage of Population Employed in Food Preparation & Serving in Green Bay, WI with 7.3%.
What is the Percentage of Population Employed in Food Preparation & Serving in Green Bay, WI?
Percentage of Population Employed in Food Preparation & Serving in Green Bay is 6.6%.
What is the Percentage of Population Employed in Food Preparation & Serving in Wisconsin?
Percentage of Population Employed in Food Preparation & Serving in Wisconsin is 5.0%.
What is the Percentage of Population Employed in Food Preparation & Serving in the United States?
Percentage of Population Employed in Food Preparation & Serving in the United States is 5.3%.