Zip Codes with the Highest Percentage of Population Employed in Security & Protection in Milwaukee, WI

RELATED REPORTS & OPTIONS

Security & Protection
Population
Families and Households
Female Fertility
Female Fertility (Unmarried)
Race (Community Size)
Race (Percentage)
Ancestry (Community Size)
AfricanAlaska NativeAlaskan AthabascanAlbanianAleutAlsatianAmericanApacheArabArgentineanArmenianAssyrian / Chaldean / SyriacAustralianAustrianBahamianBangladeshiBarbadianBelgianBelizeanBhutaneseBlackfeetBolivianBrazilianBritishBritish West IndianBulgarianBurmeseCanadianCape VerdeanCarpatho RusynCelticCentral AmericanCentral American IndianCherokeeCheyenneChickasawChileanChippewaChoctawColombianCosta RicanCreekCroatianCrowCubanCzechCzechoslovakianDanishDominicanDutchEastern EuropeanEcuadorianEgyptianEnglishEstonianEthiopianEuropeanFilipinoFinnishFrenchFrench American IndianFrench CanadianGermanGerman RussianGhanaianGreekGuamanian / ChamorroGuatemalanHaitianHonduranHungarianIcelanderIndian (Asian)IndonesianIranianIraqiIrishIroquoisIsraeliItalianJamaicanJapaneseJordanianKenyanKoreanLaotianLatvianLebaneseLithuanianLuxembourgerMacedonianMalaysianMenomineeMexicanMexican American IndianMongolianMoroccanNative HawaiianNavajoNicaraguanNigerianNorthern EuropeanNorwegianOttawaPakistaniPalestinianPanamanianParaguayanPennsylvania GermanPeruvianPimaPolishPortuguesePotawatomiPuerto RicanRomanianRussianSalvadoranSamoanScandinavianScotch-IrishScottishSeminoleSenegaleseSerbianSiouxSlavicSlovakSloveneSomaliSouth AfricanSouth AmericanSouth American IndianSpaniardSpanishSri LankanSubsaharan AfricanSwedishSwissSyrianThaiTonganTrinidadian and TobagonianTurkishUgandanUkrainianVenezuelanVietnameseWelshWest IndianYugoslavian
Ancestry (Percentage)
AfricanAlaska NativeAlaskan AthabascanAlbanianAleutAlsatianAmericanApacheArabArgentineanArmenianAssyrian / Chaldean / SyriacAustralianAustrianBahamianBangladeshiBarbadianBelgianBelizeanBhutaneseBlackfeetBolivianBrazilianBritishBritish West IndianBulgarianBurmeseCanadianCape VerdeanCarpatho RusynCelticCentral AmericanCentral American IndianCherokeeCheyenneChickasawChileanChippewaChoctawColombianCosta RicanCreekCroatianCrowCubanCzechCzechoslovakianDanishDominicanDutchEastern EuropeanEcuadorianEgyptianEnglishEstonianEthiopianEuropeanFilipinoFinnishFrenchFrench American IndianFrench CanadianGermanGerman RussianGhanaianGreekGuamanian / ChamorroGuatemalanHaitianHonduranHungarianIcelanderIndian (Asian)IndonesianIranianIraqiIrishIroquoisIsraeliItalianJamaicanJapaneseJordanianKenyanKoreanLaotianLatvianLebaneseLithuanianLuxembourgerMacedonianMalaysianMenomineeMexicanMexican American IndianMongolianMoroccanNative HawaiianNavajoNicaraguanNigerianNorthern EuropeanNorwegianOttawaPakistaniPalestinianPanamanianParaguayanPennsylvania GermanPeruvianPimaPolishPortuguesePotawatomiPuerto RicanRomanianRussianSalvadoranSamoanScandinavianScotch-IrishScottishSeminoleSenegaleseSerbianSiouxSlavicSlovakSloveneSomaliSouth AfricanSouth AmericanSouth American IndianSpaniardSpanishSri LankanSubsaharan AfricanSwedishSwissSyrianThaiTonganTrinidadian and TobagonianTurkishUgandanUkrainianVenezuelanVietnameseWelshWest IndianYugoslavian
Immigrant Origin (Total)
AfricaAlbaniaArgentinaAsiaAustraliaAustriaBangladeshBelarusBelgiumBelizeBoliviaBosnia and HerzegovinaBrazilBulgariaBurma / MyanmarCambodiaCameroonCanadaCaribbeanCentral AmericaChileChinaColombiaCongoCosta RicaCroatiaCubaCzechoslovakiaDominicaDominican RepublicEastern AfricaEastern AsiaEastern EuropeEcuadorEgyptEl SalvadorEnglandEritreaEthiopiaEuropeFranceGermanyGhanaGreeceGuatemalaHaitiHondurasHong KongHungaryIndiaIndonesiaIranIraqIrelandIsraelItalyJamaicaJapanJordanKazakhstanKenyaKoreaKuwaitLaosLatin AmericaLatviaLebanonLiberiaLithuaniaMalaysiaMexicoMiddle AfricaMoroccoNepalNetherlandsNicaraguaNigeriaNorthern AfricaNorthern EuropeOceaniaPakistanPanamaPeruPhilippinesPolandRomaniaRussiaSaudi ArabiaScotlandSenegalSerbiaSierra LeoneSingaporeSomaliaSouth AfricaSouth AmericaSouth Central AsiaSouth Eastern AsiaSouthern EuropeSpainSwedenTaiwanThailandTrinidad and TobagoTurkeyUgandaUkraineUzbekistanVenezuelaVietnamWestern AfricaWestern AsiaWestern EuropeZaire
Immigrant Origin (Percentage)
AfricaAlbaniaArgentinaAsiaAustraliaAustriaBangladeshBelarusBelgiumBelizeBoliviaBosnia and HerzegovinaBrazilBulgariaBurma / MyanmarCambodiaCameroonCanadaCaribbeanCentral AmericaChileChinaColombiaCongoCosta RicaCroatiaCubaCzechoslovakiaDominicaDominican RepublicEastern AfricaEastern AsiaEastern EuropeEcuadorEgyptEl SalvadorEnglandEritreaEthiopiaEuropeFranceGermanyGhanaGreeceGuatemalaHaitiHondurasHong KongHungaryIndiaIndonesiaIranIraqIrelandIsraelItalyJamaicaJapanJordanKazakhstanKenyaKoreaKuwaitLaosLatin AmericaLatviaLebanonLiberiaLithuaniaMalaysiaMexicoMiddle AfricaMoroccoNepalNetherlandsNicaraguaNigeriaNorthern AfricaNorthern EuropeOceaniaPakistanPanamaPeruPhilippinesPolandRomaniaRussiaSaudi ArabiaScotlandSenegalSerbiaSierra LeoneSingaporeSomaliaSouth AfricaSouth AmericaSouth Central AsiaSouth Eastern AsiaSouthern EuropeSpainSwedenTaiwanThailandTrinidad and TobagoTurkeyUgandaUkraineUzbekistanVenezuelaVietnamWestern AfricaWestern AsiaWestern EuropeZaire
Income
Income (Families)
Income (Households)
Poverty
Poverty (Families)
Unemployment
Employment Occupations
Employment Industries
Employer Class
Commute Time
Commute Means
School Enrollment
Education by Degree Field
Occupancy
Finances
Physical Characteristics
Milwaukee
Compare Zip Codes
Comparison Subject

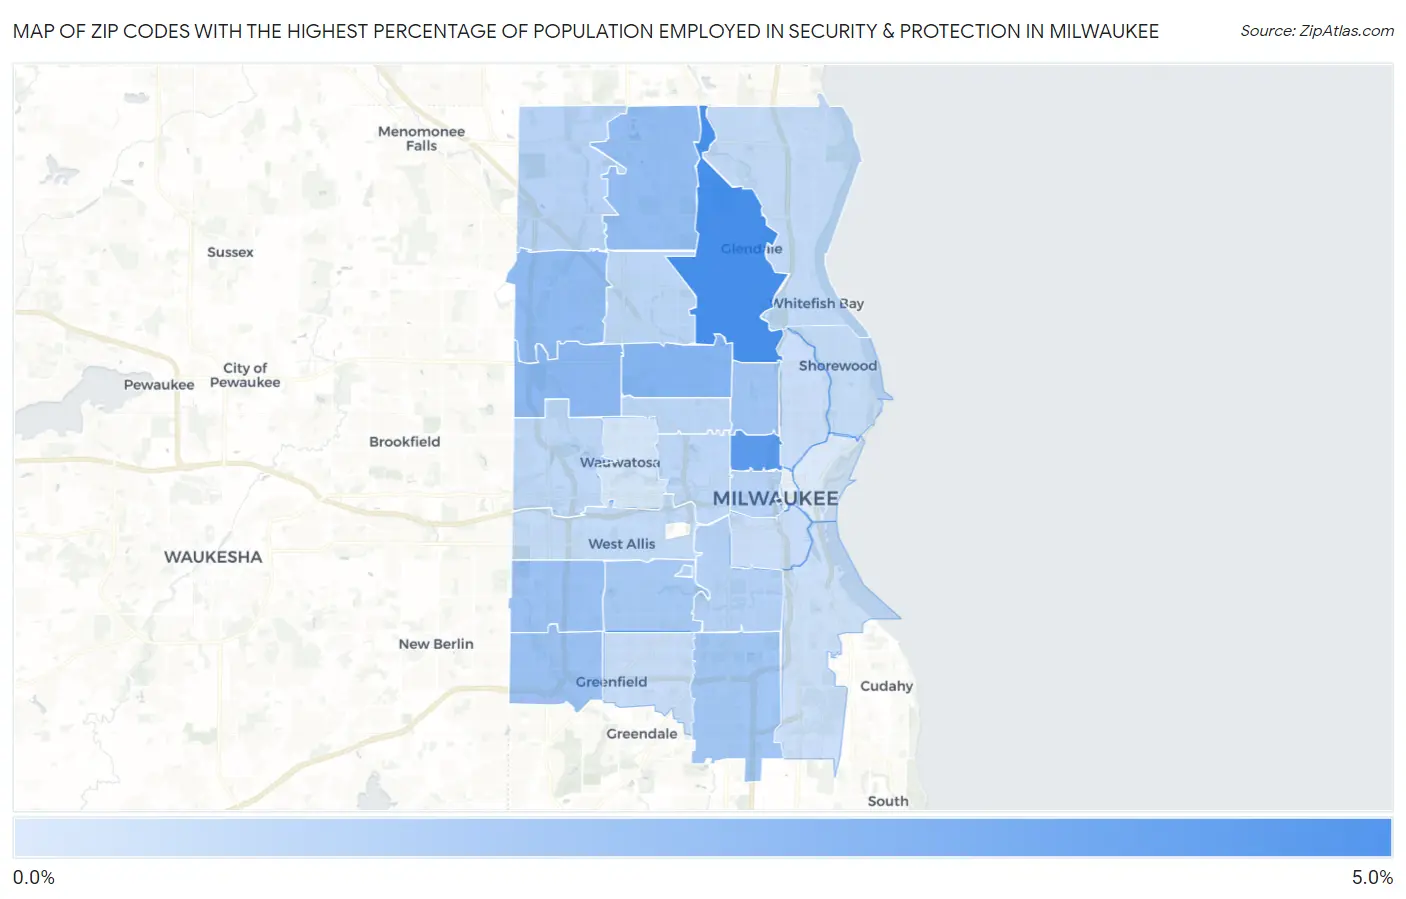
Map of Zip Codes with the Highest Percentage of Population Employed in Security & Protection in Milwaukee

0.0%
5.0%
Zip Codes with the Highest Percentage of Population Employed in Security & Protection in Milwaukee Map

Zip Codes with the Highest Percentage of Population Employed in Security & Protection in Milwaukee, WI

Zip Code % Employed vs State vs National
1.532094.6%1.6%(+2.95)#282.1%(+2.44)#3,472
2.532054.0%1.6%(+2.41)#402.1%(+1.90)#4,408
3.532163.0%1.6%(+1.34)#762.1%(+0.824)#7,333
4.532222.8%1.6%(+1.13)#932.1%(+0.615)#8,265
5.532252.6%1.6%(+1.01)#1002.1%(+0.499)#8,782
6.532232.6%1.6%(+0.948)#1112.1%(+0.434)#9,091
7.532282.4%1.6%(+0.797)#1282.1%(+0.283)#9,888
8.532272.4%1.6%(+0.789)#1322.1%(+0.275)#9,938
9.532062.2%1.6%(+0.584)#1612.1%(+0.070)#11,144
10.532212.2%1.6%(+0.538)#1712.1%(+0.024)#11,429
11.532192.0%1.6%(+0.414)#2002.1%(-0.099)#12,259
12.532151.7%1.6%(+0.079)#2542.1%(-0.435)#14,569
13.532331.6%1.6%(+0.002)#2722.1%(-0.511)#15,136
14.532241.6%1.6%(-0.014)#2762.1%(-0.528)#15,254
15.532181.5%1.6%(-0.103)#2962.1%(-0.617)#15,927
16.532101.5%1.6%(-0.120)#3012.1%(-0.634)#16,079
17.532261.4%1.6%(-0.186)#3282.1%(-0.700)#16,591
18.532081.4%1.6%(-0.186)#3292.1%(-0.700)#16,597
19.532141.4%1.6%(-0.270)#3472.1%(-0.784)#17,218
20.532171.3%1.6%(-0.289)#3572.1%(-0.803)#17,389
21.532111.3%1.6%(-0.367)#3822.1%(-0.881)#18,000
22.532201.3%1.6%(-0.382)#3902.1%(-0.896)#18,117
23.532041.2%1.6%(-0.452)#4202.1%(-0.966)#18,646
24.532121.2%1.6%(-0.467)#4262.1%(-0.980)#18,763
25.532071.1%1.6%(-0.489)#4302.1%(-1.00)#18,926
26.532130.90%1.6%(-0.737)#4952.1%(-1.25)#20,811
27.532020.71%1.6%(-0.927)#5612.1%(-1.44)#22,022

Common Questions

What are the Top 10 Zip Codes with the Highest Percentage of Population Employed in Security & Protection in Milwaukee, WI?
Top 10 Zip Codes with the Highest Percentage of Population Employed in Security & Protection in Milwaukee, WI are:
#1
4.6%
#2
4.0%
#3
3.0%
#4
2.8%
#5
2.6%
#6
2.6%
#7
2.4%
#8
2.4%
#9
2.2%
#10
2.2%
What zip code has the Highest Percentage of Population Employed in Security & Protection in Milwaukee, WI?
53209 has the Highest Percentage of Population Employed in Security & Protection in Milwaukee, WI with 4.6%.
What is the Percentage of Population Employed in Security & Protection in Milwaukee, WI?
Percentage of Population Employed in Security & Protection in Milwaukee is 2.0%.
What is the Percentage of Population Employed in Security & Protection in Wisconsin?
Percentage of Population Employed in Security & Protection in Wisconsin is 1.6%.
What is the Percentage of Population Employed in Security & Protection in the United States?
Percentage of Population Employed in Security & Protection in the United States is 2.1%.