Zip Codes with the Highest Percentage of Population with a Degree in Science and Engineering in Kennewick, WA
RELATED REPORTS & OPTIONS
Science and Engineering
Kennewick
Compare Zip Codes
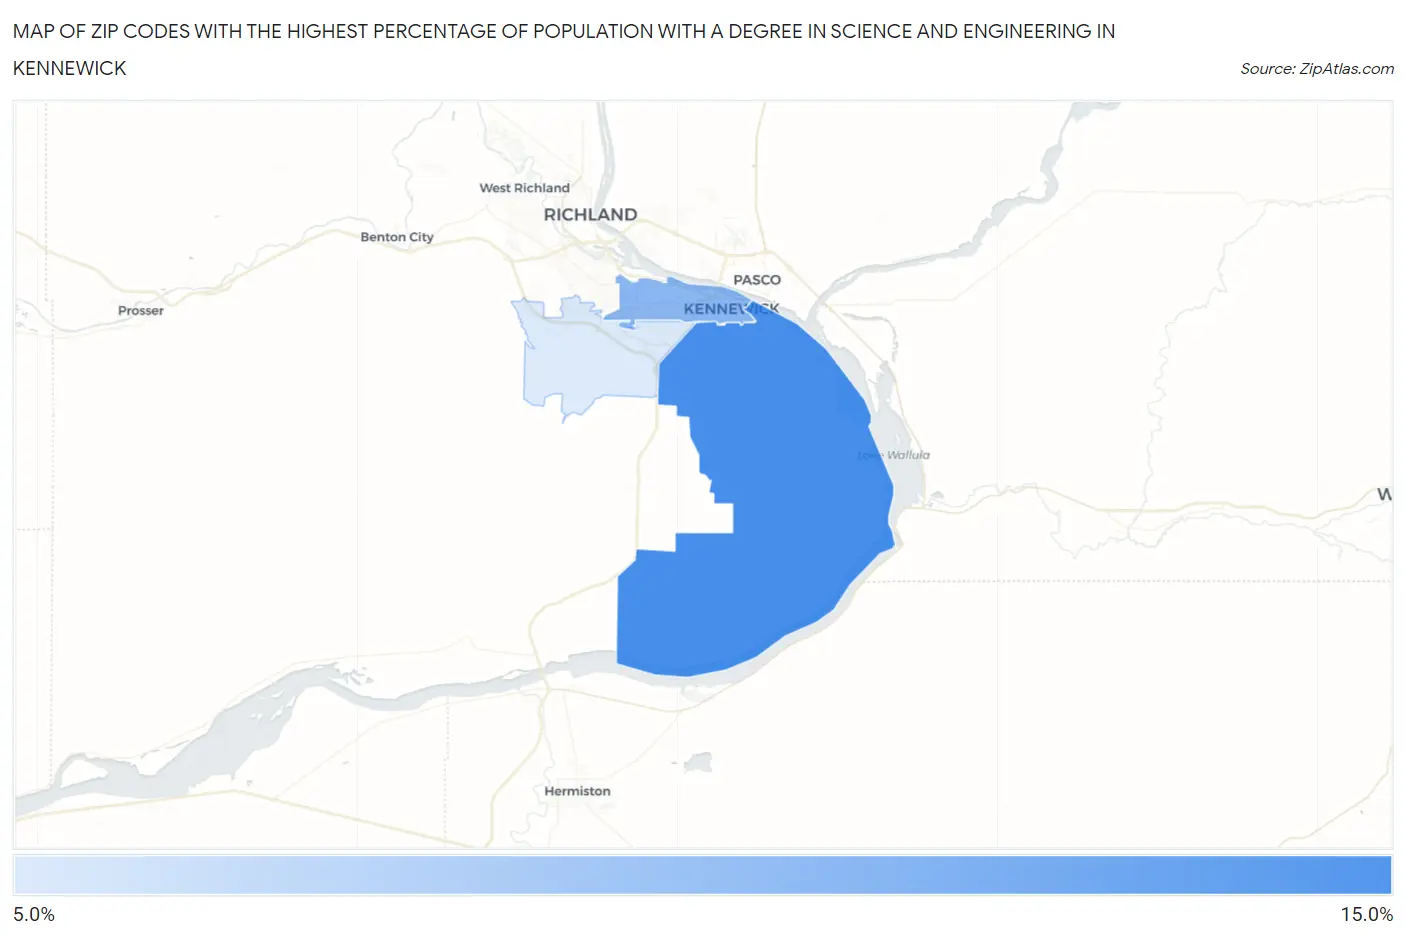
Map of Zip Codes with the Highest Percentage of Population with a Degree in Science and Engineering in Kennewick
8.8%
14.5%
Zip Codes with the Highest Percentage of Population with a Degree in Science and Engineering in Kennewick, WA
| Zip Code | % Graduates | vs State | vs National | |
| 1. | 99337 | 14.5% | 8.7%(+5.77)#74 | 9.8%(+4.73)#7,228 |
| 2. | 99336 | 11.9% | 8.7%(+3.16)#132 | 9.8%(+2.12)#11,088 |
| 3. | 99338 | 8.8% | 8.7%(+0.049)#266 | 9.8%(-0.993)#17,824 |
1
Common Questions
What are the Top Zip Codes with the Highest Percentage of Population with a Degree in Science and Engineering in Kennewick, WA?
Top Zip Codes with the Highest Percentage of Population with a Degree in Science and Engineering in Kennewick, WA are:
What zip code has the Highest Percentage of Population with a Degree in Science and Engineering in Kennewick, WA?
99337 has the Highest Percentage of Population with a Degree in Science and Engineering in Kennewick, WA with 14.5%.
What is the Percentage of Population with a Degree in Science and Engineering in Kennewick, WA?
Percentage of Population with a Degree in Science and Engineering in Kennewick is 13.1%.
What is the Percentage of Population with a Degree in Science and Engineering in Washington?
Percentage of Population with a Degree in Science and Engineering in Washington is 8.7%.
What is the Percentage of Population with a Degree in Science and Engineering in the United States?
Percentage of Population with a Degree in Science and Engineering in the United States is 9.8%.