Zip Codes with the Highest Percentage of Population Employed in Office & Administration in Kennewick, WA
RELATED REPORTS & OPTIONS
Office & Administration
Kennewick
Compare Zip Codes
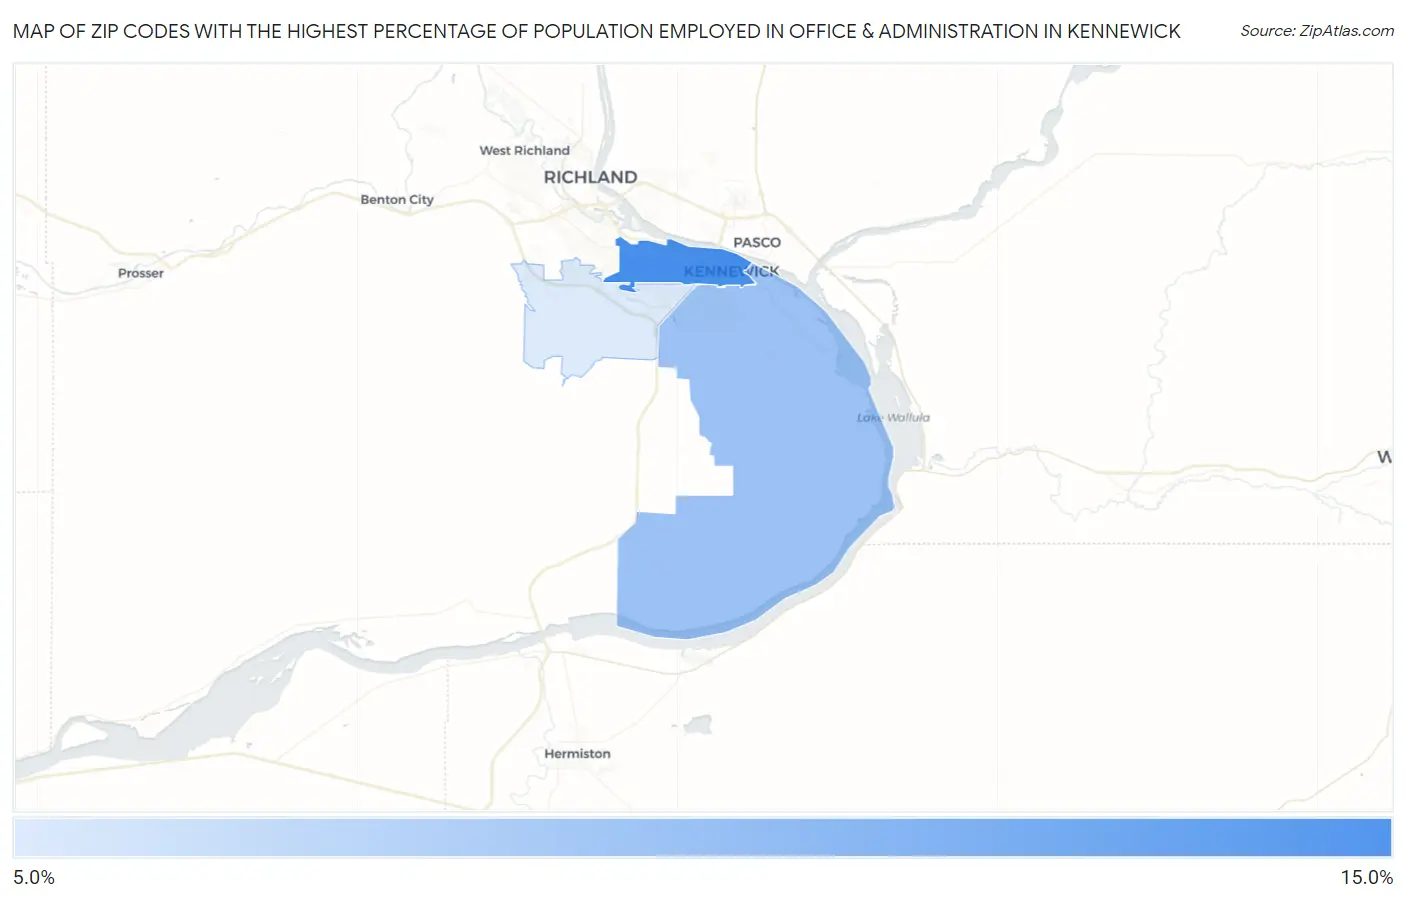
Map of Zip Codes with the Highest Percentage of Population Employed in Office & Administration in Kennewick
9.0%
11.2%
Zip Codes with the Highest Percentage of Population Employed in Office & Administration in Kennewick, WA
| Zip Code | % Employed | vs State | vs National | |
| 1. | 99336 | 11.2% | 9.8%(+1.41)#185 | 10.9%(+0.344)#13,207 |
| 2. | 99337 | 10.0% | 9.8%(+0.161)#264 | 10.9%(-0.901)#17,266 |
| 3. | 99338 | 9.0% | 9.8%(-0.786)#322 | 10.9%(-1.85)#20,235 |
1
Common Questions
What are the Top Zip Codes with the Highest Percentage of Population Employed in Office & Administration in Kennewick, WA?
Top Zip Codes with the Highest Percentage of Population Employed in Office & Administration in Kennewick, WA are:
What zip code has the Highest Percentage of Population Employed in Office & Administration in Kennewick, WA?
99336 has the Highest Percentage of Population Employed in Office & Administration in Kennewick, WA with 11.2%.
What is the Percentage of Population Employed in Office & Administration in Kennewick, WA?
Percentage of Population Employed in Office & Administration in Kennewick is 11.2%.
What is the Percentage of Population Employed in Office & Administration in Washington?
Percentage of Population Employed in Office & Administration in Washington is 9.8%.
What is the Percentage of Population Employed in Office & Administration in the United States?
Percentage of Population Employed in Office & Administration in the United States is 10.9%.