Spaniard vs Immigrants from Austria 4 or more Vehicles in Household
COMPARE
Spaniard
Immigrants from Austria
4 or more Vehicles in Household
4 or more Vehicles in Household Comparison
Spaniards
Immigrants from Austria
7.6%
4 OR MORE VEHICLES IN HOUSEHOLD
100.0/ 100
METRIC RATING
60th/ 347
METRIC RANK
6.0%
4 OR MORE VEHICLES IN HOUSEHOLD
14.3/ 100
METRIC RATING
214th/ 347
METRIC RANK
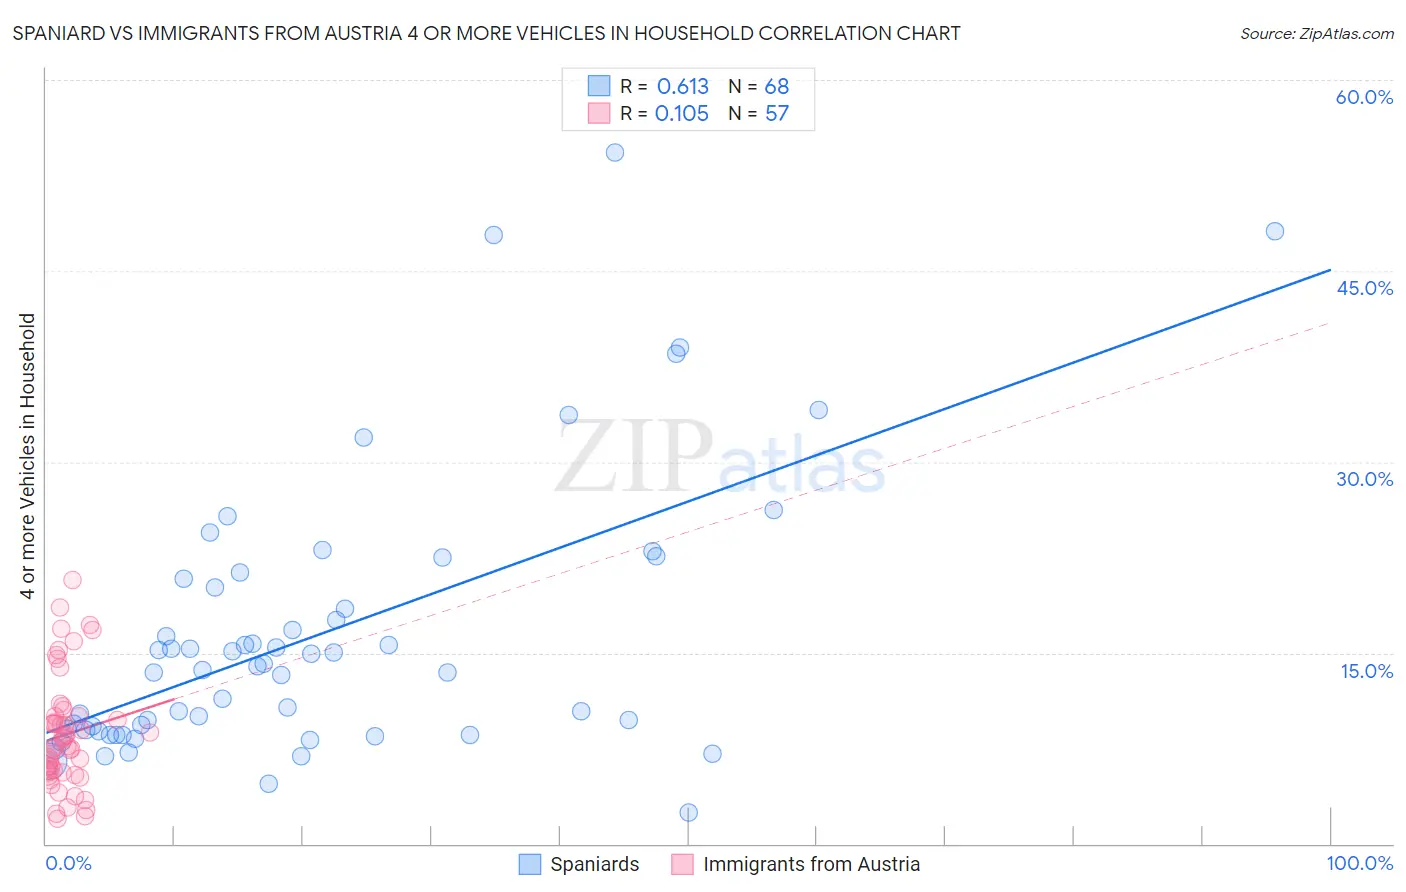
Spaniard vs Immigrants from Austria 4 or more Vehicles in Household Correlation Chart
The statistical analysis conducted on geographies consisting of 441,319,391 people shows a significant positive correlation between the proportion of Spaniards and percentage of households with 4 or more vehicles available in the United States with a correlation coefficient (R) of 0.613 and weighted average of 7.6%. Similarly, the statistical analysis conducted on geographies consisting of 167,408,927 people shows a poor positive correlation between the proportion of Immigrants from Austria and percentage of households with 4 or more vehicles available in the United States with a correlation coefficient (R) of 0.105 and weighted average of 6.0%, a difference of 26.0%.
4 or more Vehicles in Household Correlation Summary
| Measurement | Spaniard | Immigrants from Austria |
| Minimum | 2.4% | 2.0% |
| Maximum | 54.3% | 20.8% |
| Range | 51.9% | 18.8% |
| Mean | 16.4% | 8.6% |
| Median | 13.8% | 7.6% |
| Interquartile 25% (IQ1) | 8.9% | 5.6% |
| Interquartile 75% (IQ3) | 20.5% | 10.0% |
| Interquartile Range (IQR) | 11.6% | 4.4% |
| Standard Deviation (Sample) | 10.8% | 4.4% |
| Standard Deviation (Population) | 10.7% | 4.3% |
Similar Demographics by 4 or more Vehicles in Household
Demographics Similar to Spaniards by 4 or more Vehicles in Household
In terms of 4 or more vehicles in household, the demographic groups most similar to Spaniards are Hispanic or Latino (7.6%, a difference of 0.060%), Pennsylvania German (7.6%, a difference of 0.10%), Swedish (7.6%, a difference of 0.10%), English (7.6%, a difference of 0.22%), and Immigrants from Oceania (7.6%, a difference of 0.24%).
| Demographics | Rating | Rank | 4 or more Vehicles in Household |
| Malaysians | 100.0 /100 | #53 | Exceptional 7.7% |
| Dutch | 100.0 /100 | #54 | Exceptional 7.7% |
| Immigrants | Oceania | 100.0 /100 | #55 | Exceptional 7.6% |
| English | 100.0 /100 | #56 | Exceptional 7.6% |
| Pennsylvania Germans | 100.0 /100 | #57 | Exceptional 7.6% |
| Swedes | 100.0 /100 | #58 | Exceptional 7.6% |
| Hispanics or Latinos | 100.0 /100 | #59 | Exceptional 7.6% |
| Spaniards | 100.0 /100 | #60 | Exceptional 7.6% |
| Europeans | 100.0 /100 | #61 | Exceptional 7.6% |
| Chippewa | 100.0 /100 | #62 | Exceptional 7.6% |
| Immigrants | Micronesia | 100.0 /100 | #63 | Exceptional 7.6% |
| Bangladeshis | 100.0 /100 | #64 | Exceptional 7.6% |
| Immigrants | Azores | 100.0 /100 | #65 | Exceptional 7.5% |
| Immigrants | Taiwan | 99.9 /100 | #66 | Exceptional 7.5% |
| Americans | 99.9 /100 | #67 | Exceptional 7.5% |
Demographics Similar to Immigrants from Austria by 4 or more Vehicles in Household
In terms of 4 or more vehicles in household, the demographic groups most similar to Immigrants from Austria are Arab (6.0%, a difference of 0.020%), Immigrants from Egypt (6.0%, a difference of 0.080%), Panamanian (6.0%, a difference of 0.090%), Immigrants from China (6.0%, a difference of 0.11%), and Immigrants from Romania (6.0%, a difference of 0.11%).
| Demographics | Rating | Rank | 4 or more Vehicles in Household |
| Immigrants | Chile | 16.9 /100 | #207 | Poor 6.1% |
| Immigrants | Nigeria | 15.6 /100 | #208 | Poor 6.1% |
| Immigrants | Honduras | 15.4 /100 | #209 | Poor 6.1% |
| Immigrants | Zimbabwe | 15.1 /100 | #210 | Poor 6.0% |
| Panamanians | 14.8 /100 | #211 | Poor 6.0% |
| Immigrants | Egypt | 14.7 /100 | #212 | Poor 6.0% |
| Arabs | 14.4 /100 | #213 | Poor 6.0% |
| Immigrants | Austria | 14.3 /100 | #214 | Poor 6.0% |
| Immigrants | China | 13.8 /100 | #215 | Poor 6.0% |
| Immigrants | Romania | 13.8 /100 | #216 | Poor 6.0% |
| Nigerians | 12.2 /100 | #217 | Poor 6.0% |
| Immigrants | Italy | 11.0 /100 | #218 | Poor 6.0% |
| Serbians | 11.0 /100 | #219 | Poor 6.0% |
| Russians | 10.3 /100 | #220 | Poor 6.0% |
| Immigrants | Moldova | 9.3 /100 | #221 | Tragic 6.0% |