Spaniard vs Immigrants from Austria Male Unemployment
COMPARE
Spaniard
Immigrants from Austria
Male Unemployment
Male Unemployment Comparison
Spaniards
Immigrants from Austria
5.3%
MALE UNEMPLOYMENT
35.1/ 100
METRIC RATING
184th/ 347
METRIC RANK
5.1%
MALE UNEMPLOYMENT
90.3/ 100
METRIC RATING
113th/ 347
METRIC RANK
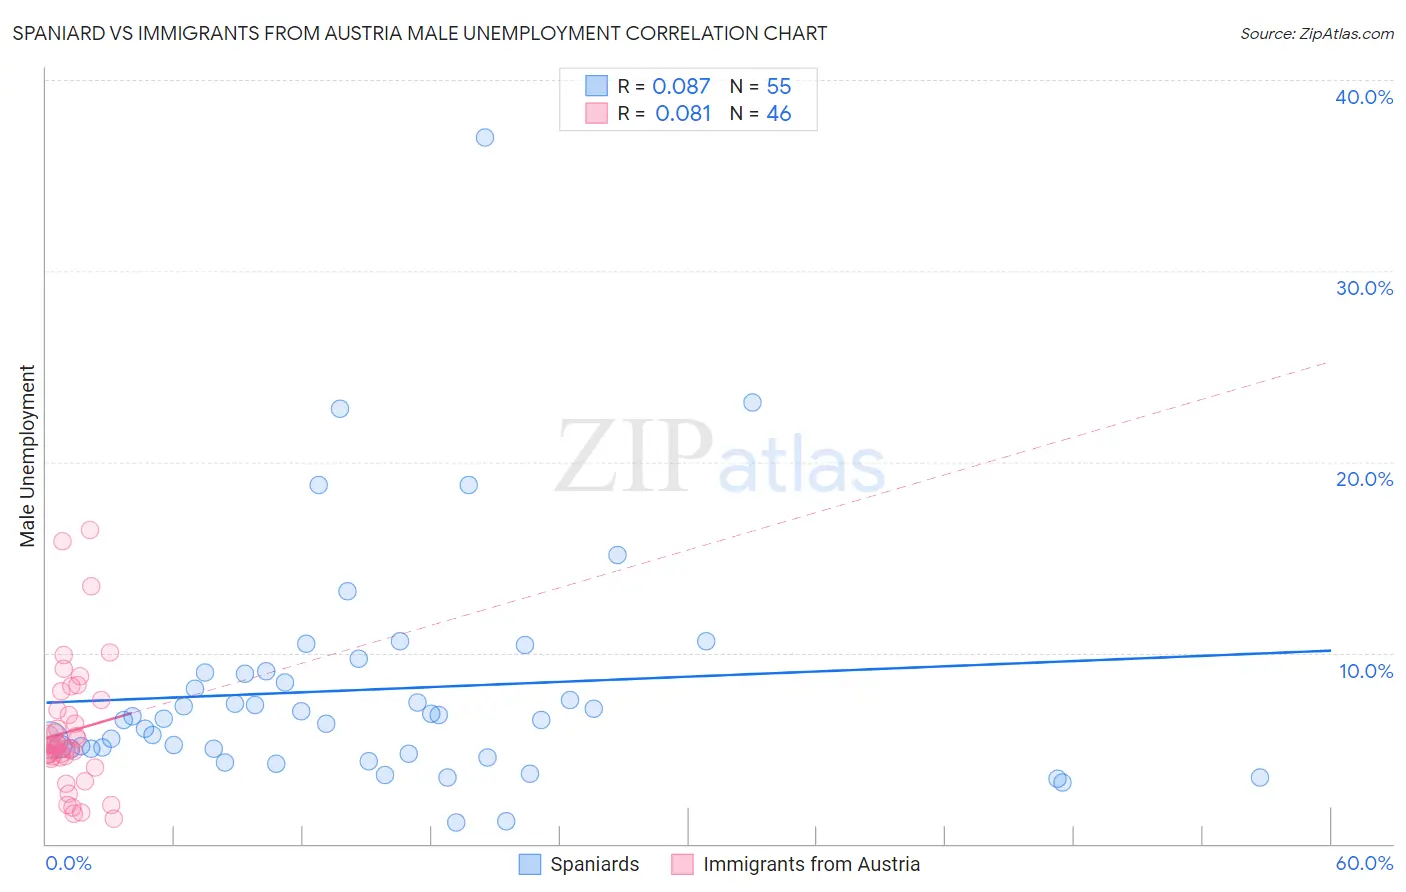
Spaniard vs Immigrants from Austria Male Unemployment Correlation Chart
The statistical analysis conducted on geographies consisting of 441,055,878 people shows a slight positive correlation between the proportion of Spaniards and unemployment rate among males in the United States with a correlation coefficient (R) of 0.087 and weighted average of 5.3%. Similarly, the statistical analysis conducted on geographies consisting of 167,645,356 people shows a slight positive correlation between the proportion of Immigrants from Austria and unemployment rate among males in the United States with a correlation coefficient (R) of 0.081 and weighted average of 5.1%, a difference of 4.3%.
Male Unemployment Correlation Summary
| Measurement | Spaniard | Immigrants from Austria |
| Minimum | 1.1% | 1.3% |
| Maximum | 37.0% | 16.4% |
| Range | 35.9% | 15.1% |
| Mean | 8.1% | 5.9% |
| Median | 6.6% | 5.2% |
| Interquartile 25% (IQ1) | 5.0% | 4.5% |
| Interquartile 75% (IQ3) | 8.9% | 7.0% |
| Interquartile Range (IQR) | 4.0% | 2.5% |
| Standard Deviation (Sample) | 6.1% | 3.3% |
| Standard Deviation (Population) | 6.0% | 3.3% |
Similar Demographics by Male Unemployment
Demographics Similar to Spaniards by Male Unemployment
In terms of male unemployment, the demographic groups most similar to Spaniards are Korean (5.3%, a difference of 0.010%), Taiwanese (5.3%, a difference of 0.16%), Potawatomi (5.3%, a difference of 0.17%), Immigrants from Afghanistan (5.3%, a difference of 0.18%), and Iraqi (5.4%, a difference of 0.23%).
| Demographics | Rating | Rank | Male Unemployment |
| Immigrants | Peru | 44.6 /100 | #177 | Average 5.3% |
| Osage | 42.5 /100 | #178 | Average 5.3% |
| Immigrants | Oceania | 40.8 /100 | #179 | Average 5.3% |
| Malaysians | 39.6 /100 | #180 | Fair 5.3% |
| Immigrants | Afghanistan | 37.9 /100 | #181 | Fair 5.3% |
| Potawatomi | 37.8 /100 | #182 | Fair 5.3% |
| Taiwanese | 37.6 /100 | #183 | Fair 5.3% |
| Spaniards | 35.1 /100 | #184 | Fair 5.3% |
| Koreans | 34.9 /100 | #185 | Fair 5.3% |
| Iraqis | 31.6 /100 | #186 | Fair 5.4% |
| Costa Ricans | 31.3 /100 | #187 | Fair 5.4% |
| Arabs | 30.2 /100 | #188 | Fair 5.4% |
| Immigrants | South America | 29.4 /100 | #189 | Fair 5.4% |
| Immigrants | Uganda | 28.8 /100 | #190 | Fair 5.4% |
| Immigrants | South Eastern Asia | 28.2 /100 | #191 | Fair 5.4% |
Demographics Similar to Immigrants from Austria by Male Unemployment
In terms of male unemployment, the demographic groups most similar to Immigrants from Austria are Immigrants from Moldova (5.1%, a difference of 0.010%), Romanian (5.1%, a difference of 0.080%), Immigrants from Eastern Asia (5.1%, a difference of 0.090%), Immigrants from England (5.1%, a difference of 0.10%), and Immigrants from Asia (5.1%, a difference of 0.11%).
| Demographics | Rating | Rank | Male Unemployment |
| Immigrants | Ethiopia | 91.5 /100 | #106 | Exceptional 5.1% |
| Ethiopians | 91.3 /100 | #107 | Exceptional 5.1% |
| Immigrants | Nicaragua | 91.2 /100 | #108 | Exceptional 5.1% |
| Immigrants | Pakistan | 90.9 /100 | #109 | Exceptional 5.1% |
| Immigrants | England | 90.8 /100 | #110 | Exceptional 5.1% |
| Immigrants | Eastern Asia | 90.8 /100 | #111 | Exceptional 5.1% |
| Immigrants | Moldova | 90.3 /100 | #112 | Exceptional 5.1% |
| Immigrants | Austria | 90.3 /100 | #113 | Exceptional 5.1% |
| Romanians | 89.8 /100 | #114 | Excellent 5.1% |
| Immigrants | Asia | 89.6 /100 | #115 | Excellent 5.1% |
| Immigrants | Denmark | 89.4 /100 | #116 | Excellent 5.1% |
| Estonians | 89.0 /100 | #117 | Excellent 5.1% |
| Cypriots | 88.8 /100 | #118 | Excellent 5.1% |
| French Canadians | 88.6 /100 | #119 | Excellent 5.1% |
| Ukrainians | 88.4 /100 | #120 | Excellent 5.1% |