Irish vs Immigrants from Spain 1 or more Vehicles in Household
COMPARE
Irish
Immigrants from Spain
1 or more Vehicles in Household
1 or more Vehicles in Household Comparison
Irish
Immigrants from Spain
93.1%
1 OR MORE VEHICLES IN HOUSEHOLD
100.0/ 100
METRIC RATING
14th/ 347
METRIC RANK
85.8%
1 OR MORE VEHICLES IN HOUSEHOLD
0.0/ 100
METRIC RATING
296th/ 347
METRIC RANK
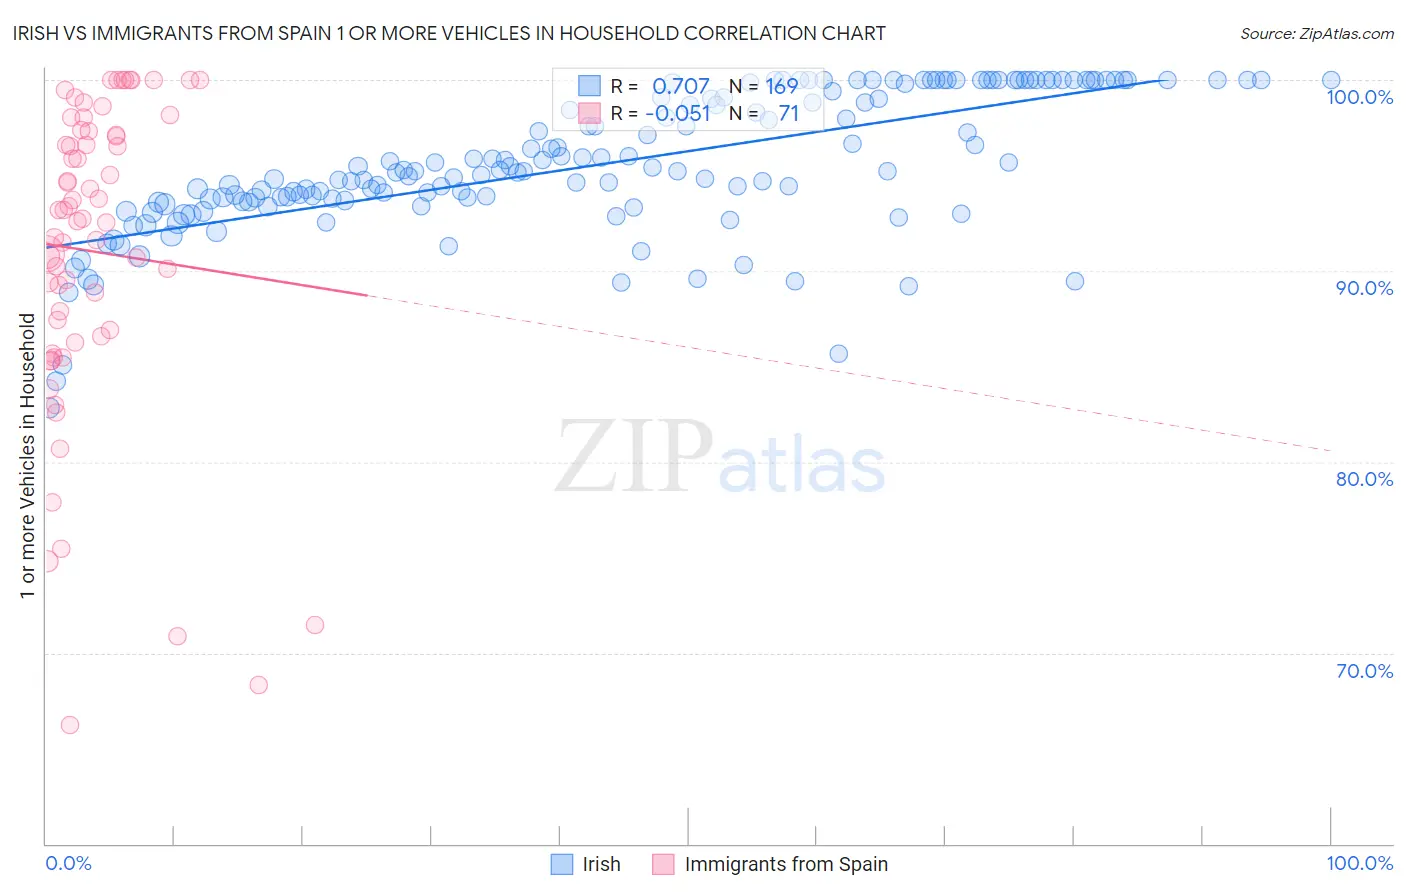
Irish vs Immigrants from Spain 1 or more Vehicles in Household Correlation Chart
The statistical analysis conducted on geographies consisting of 554,668,080 people shows a strong positive correlation between the proportion of Irish and percentage of households with 1 or more vehicles available in the United States with a correlation coefficient (R) of 0.707 and weighted average of 93.1%. Similarly, the statistical analysis conducted on geographies consisting of 239,528,029 people shows a slight negative correlation between the proportion of Immigrants from Spain and percentage of households with 1 or more vehicles available in the United States with a correlation coefficient (R) of -0.051 and weighted average of 85.8%, a difference of 8.5%.
1 or more Vehicles in Household Correlation Summary
| Measurement | Irish | Immigrants from Spain |
| Minimum | 82.8% | 66.2% |
| Maximum | 100.0% | 100.0% |
| Range | 17.2% | 33.8% |
| Mean | 95.6% | 91.0% |
| Median | 95.2% | 92.8% |
| Interquartile 25% (IQ1) | 93.6% | 86.6% |
| Interquartile 75% (IQ3) | 99.6% | 97.3% |
| Interquartile Range (IQR) | 6.0% | 10.8% |
| Standard Deviation (Sample) | 3.6% | 8.2% |
| Standard Deviation (Population) | 3.6% | 8.1% |
Similar Demographics by 1 or more Vehicles in Household
Demographics Similar to Irish by 1 or more Vehicles in Household
In terms of 1 or more vehicles in household, the demographic groups most similar to Irish are Mexican (93.0%, a difference of 0.020%), Assyrian/Chaldean/Syriac (93.0%, a difference of 0.020%), White/Caucasian (93.1%, a difference of 0.040%), European (93.0%, a difference of 0.040%), and Scandinavian (93.1%, a difference of 0.060%).
| Demographics | Rating | Rank | 1 or more Vehicles in Household |
| Scottish | 100.0 /100 | #7 | Exceptional 93.4% |
| Swedes | 100.0 /100 | #8 | Exceptional 93.3% |
| Scotch-Irish | 100.0 /100 | #9 | Exceptional 93.3% |
| Dutch | 100.0 /100 | #10 | Exceptional 93.3% |
| Czechs | 100.0 /100 | #11 | Exceptional 93.3% |
| Scandinavians | 100.0 /100 | #12 | Exceptional 93.1% |
| Whites/Caucasians | 100.0 /100 | #13 | Exceptional 93.1% |
| Irish | 100.0 /100 | #14 | Exceptional 93.1% |
| Mexicans | 100.0 /100 | #15 | Exceptional 93.0% |
| Assyrians/Chaldeans/Syriacs | 100.0 /100 | #16 | Exceptional 93.0% |
| Europeans | 100.0 /100 | #17 | Exceptional 93.0% |
| Welsh | 100.0 /100 | #18 | Exceptional 93.0% |
| Tongans | 100.0 /100 | #19 | Exceptional 92.9% |
| Arapaho | 100.0 /100 | #20 | Exceptional 92.7% |
| Ottawa | 100.0 /100 | #21 | Exceptional 92.7% |
Demographics Similar to Immigrants from Spain by 1 or more Vehicles in Household
In terms of 1 or more vehicles in household, the demographic groups most similar to Immigrants from Spain are Immigrants from Jamaica (85.8%, a difference of 0.030%), Paraguayan (85.7%, a difference of 0.090%), Belizean (85.7%, a difference of 0.17%), Alaskan Athabascan (86.0%, a difference of 0.20%), and Indian (Asian) (86.0%, a difference of 0.28%).
| Demographics | Rating | Rank | 1 or more Vehicles in Household |
| Immigrants | Ireland | 0.0 /100 | #289 | Tragic 86.4% |
| Immigrants | Australia | 0.0 /100 | #290 | Tragic 86.4% |
| Pima | 0.0 /100 | #291 | Tragic 86.3% |
| Okinawans | 0.0 /100 | #292 | Tragic 86.1% |
| Indians (Asian) | 0.0 /100 | #293 | Tragic 86.0% |
| Alaskan Athabascans | 0.0 /100 | #294 | Tragic 86.0% |
| Immigrants | Jamaica | 0.0 /100 | #295 | Tragic 85.8% |
| Immigrants | Spain | 0.0 /100 | #296 | Tragic 85.8% |
| Paraguayans | 0.0 /100 | #297 | Tragic 85.7% |
| Belizeans | 0.0 /100 | #298 | Tragic 85.7% |
| Yuman | 0.0 /100 | #299 | Tragic 85.5% |
| Immigrants | Russia | 0.0 /100 | #300 | Tragic 85.4% |
| Immigrants | Panama | 0.0 /100 | #301 | Tragic 85.4% |
| Moroccans | 0.0 /100 | #302 | Tragic 85.4% |
| Immigrants | Greece | 0.0 /100 | #303 | Tragic 85.4% |