Albanian vs Immigrants from Dominica 1 or more Vehicles in Household
COMPARE
Albanian
Immigrants from Dominica
1 or more Vehicles in Household
1 or more Vehicles in Household Comparison
Albanians
Immigrants from Dominica
84.4%
1 OR MORE VEHICLES IN HOUSEHOLD
0.0/ 100
METRIC RATING
314th/ 347
METRIC RANK
77.8%
1 OR MORE VEHICLES IN HOUSEHOLD
0.0/ 100
METRIC RATING
329th/ 347
METRIC RANK
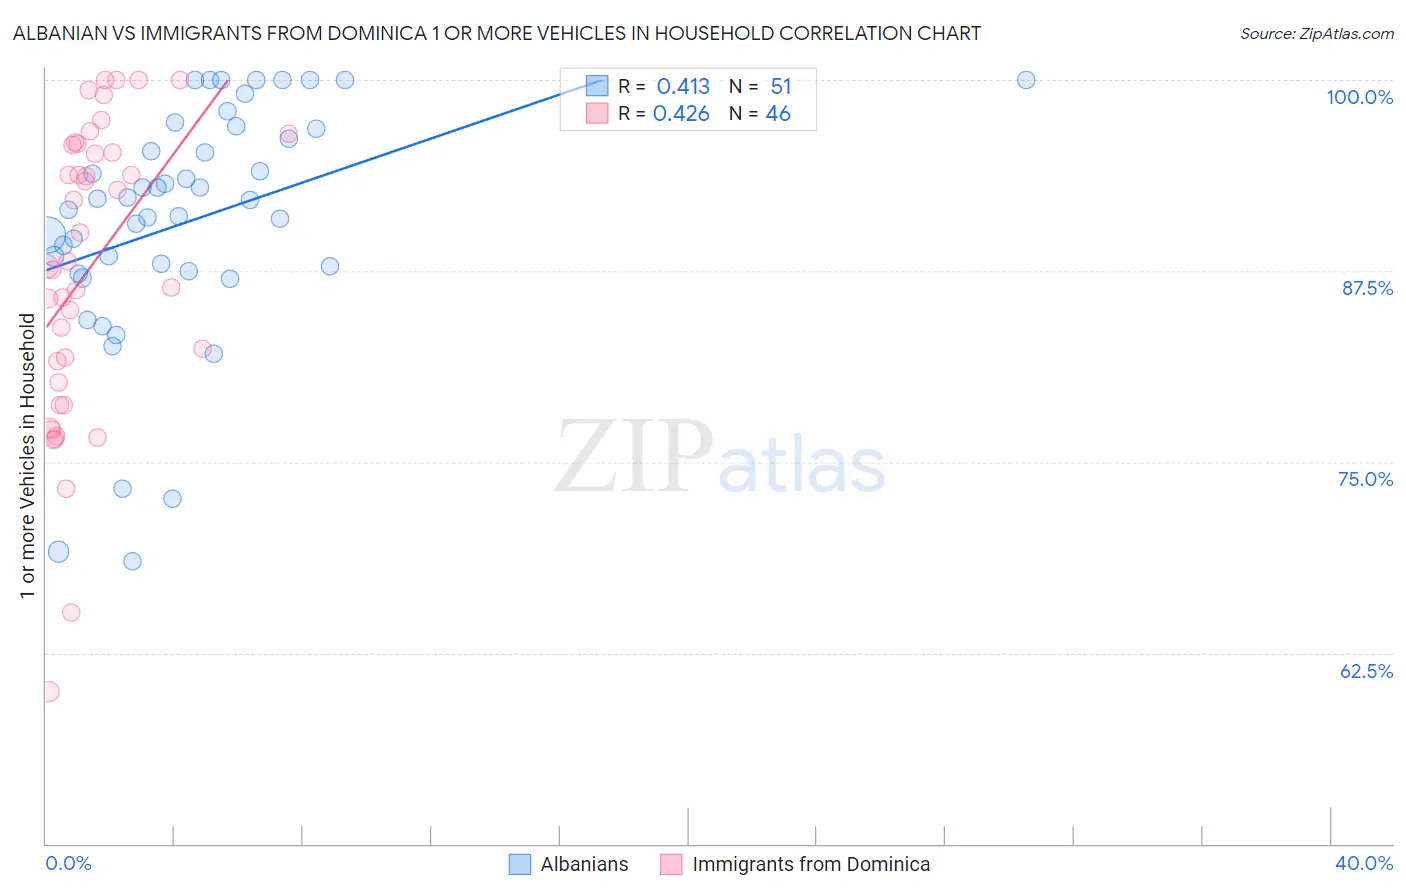
Albanian vs Immigrants from Dominica 1 or more Vehicles in Household Correlation Chart
The statistical analysis conducted on geographies consisting of 193,195,026 people shows a moderate positive correlation between the proportion of Albanians and percentage of households with 1 or more vehicles available in the United States with a correlation coefficient (R) of 0.413 and weighted average of 84.4%. Similarly, the statistical analysis conducted on geographies consisting of 83,789,752 people shows a moderate positive correlation between the proportion of Immigrants from Dominica and percentage of households with 1 or more vehicles available in the United States with a correlation coefficient (R) of 0.426 and weighted average of 77.8%, a difference of 8.5%.
1 or more Vehicles in Household Correlation Summary
| Measurement | Albanian | Immigrants from Dominica |
| Minimum | 68.5% | 60.0% |
| Maximum | 100.0% | 100.0% |
| Range | 31.5% | 40.0% |
| Mean | 90.8% | 87.6% |
| Median | 92.1% | 88.0% |
| Interquartile 25% (IQ1) | 87.5% | 80.2% |
| Interquartile 75% (IQ3) | 96.8% | 95.7% |
| Interquartile Range (IQR) | 9.3% | 15.5% |
| Standard Deviation (Sample) | 7.8% | 9.7% |
| Standard Deviation (Population) | 7.7% | 9.6% |
Demographics Similar to Albanians and Immigrants from Dominica by 1 or more Vehicles in Household
In terms of 1 or more vehicles in household, the demographic groups most similar to Albanians are Immigrants from Israel (84.5%, a difference of 0.070%), Cypriot (84.4%, a difference of 0.070%), Cape Verdean (84.5%, a difference of 0.090%), Puerto Rican (84.6%, a difference of 0.20%), and Alaska Native (83.8%, a difference of 0.76%). Similarly, the demographic groups most similar to Immigrants from Dominica are Ecuadorian (77.9%, a difference of 0.14%), Immigrants from Trinidad and Tobago (76.8%, a difference of 1.4%), Immigrants from Senegal (79.0%, a difference of 1.5%), West Indian (76.4%, a difference of 1.9%), and Immigrants from West Indies (79.5%, a difference of 2.1%).
| Demographics | Rating | Rank | 1 or more Vehicles in Household |
| Puerto Ricans | 0.0 /100 | #311 | Tragic 84.6% |
| Cape Verdeans | 0.0 /100 | #312 | Tragic 84.5% |
| Immigrants | Israel | 0.0 /100 | #313 | Tragic 84.5% |
| Albanians | 0.0 /100 | #314 | Tragic 84.4% |
| Cypriots | 0.0 /100 | #315 | Tragic 84.4% |
| Alaska Natives | 0.0 /100 | #316 | Tragic 83.8% |
| Ghanaians | 0.0 /100 | #317 | Tragic 83.6% |
| Immigrants | Ghana | 0.0 /100 | #318 | Tragic 83.4% |
| Immigrants | Belarus | 0.0 /100 | #319 | Tragic 83.3% |
| Soviet Union | 0.0 /100 | #320 | Tragic 82.7% |
| Jamaicans | 0.0 /100 | #321 | Tragic 82.1% |
| Immigrants | Cabo Verde | 0.0 /100 | #322 | Tragic 81.6% |
| Immigrants | Yemen | 0.0 /100 | #323 | Tragic 80.5% |
| Immigrants | Caribbean | 0.0 /100 | #324 | Tragic 80.4% |
| Senegalese | 0.0 /100 | #325 | Tragic 80.4% |
| Immigrants | West Indies | 0.0 /100 | #326 | Tragic 79.5% |
| Immigrants | Senegal | 0.0 /100 | #327 | Tragic 79.0% |
| Ecuadorians | 0.0 /100 | #328 | Tragic 77.9% |
| Immigrants | Dominica | 0.0 /100 | #329 | Tragic 77.8% |
| Immigrants | Trinidad and Tobago | 0.0 /100 | #330 | Tragic 76.8% |
| West Indians | 0.0 /100 | #331 | Tragic 76.4% |