Zip Codes with the Highest Percentage of Households with Income Above $100,000 in Chesapeake, VA

RELATED REPORTS & OPTIONS

Household Income | $100k+
Population
Families and Households
Female Fertility
Female Fertility (Unmarried)
Race (Community Size)
Race (Percentage)
Ancestry (Community Size)
AfghanAfricanAmericanArabArmenianAustralianAustrianBarbadianBelgianBermudanBhutaneseBlackfeetBolivianBrazilianBritishBurmeseCajunCanadianCentral AmericanCentral American IndianCherokeeChileanChippewaColombianCreekCroatianCubanCzechCzechoslovakianDanishDominicanDutchEastern EuropeanEcuadorianEgyptianEnglishEthiopianEuropeanFinnishFrenchFrench CanadianGermanGhanaianGreekGuamanian / ChamorroGuatemalanGuyaneseHaitianHonduranHungarianIndian (Asian)IranianIrishIroquoisItalianJamaicanKenyanKoreanLatvianLebaneseLithuanianLumbeeMalaysianMexicanMoroccanNative HawaiianNicaraguanNigerianNorthern EuropeanNorwegianPakistaniPanamanianPeruvianPolishPortuguesePuerto RicanRomanianRussianSalvadoranSamoanScandinavianScotch-IrishScottishSiouxSlavicSlovakSloveneSouth AmericanSouth American IndianSpaniardSpanishSri LankanSubsaharan AfricanSwedishSwissThaiTrinidadian and TobagonianTurkishUkrainianVenezuelanWelshWest IndianYugoslavian
Ancestry (Percentage)
AfghanAfricanAmericanArabArmenianAustralianAustrianBarbadianBelgianBermudanBhutaneseBlackfeetBolivianBrazilianBritishBurmeseCajunCanadianCentral AmericanCentral American IndianCherokeeChileanChippewaColombianCreekCroatianCubanCzechCzechoslovakianDanishDominicanDutchEastern EuropeanEcuadorianEgyptianEnglishEthiopianEuropeanFinnishFrenchFrench CanadianGermanGhanaianGreekGuamanian / ChamorroGuatemalanGuyaneseHaitianHonduranHungarianIndian (Asian)IranianIrishIroquoisItalianJamaicanKenyanKoreanLatvianLebaneseLithuanianLumbeeMalaysianMexicanMoroccanNative HawaiianNicaraguanNigerianNorthern EuropeanNorwegianPakistaniPanamanianPeruvianPolishPortuguesePuerto RicanRomanianRussianSalvadoranSamoanScandinavianScotch-IrishScottishSiouxSlavicSlovakSloveneSouth AmericanSouth American IndianSpaniardSpanishSri LankanSubsaharan AfricanSwedishSwissThaiTrinidadian and TobagonianTurkishUkrainianVenezuelanWelshWest IndianYugoslavian
Immigrant Origin (Total)
Immigrant Origin (Percentage)
Income
Income (Families)
Income (Households)
Poverty
Poverty (Families)
Unemployment
Employment Occupations
Employment Industries
Employer Class
Commute Time
Commute Means
School Enrollment
Education by Degree Field
Occupancy
Finances
Physical Characteristics
Chesapeake
Compare Zip Codes
Comparison Subject

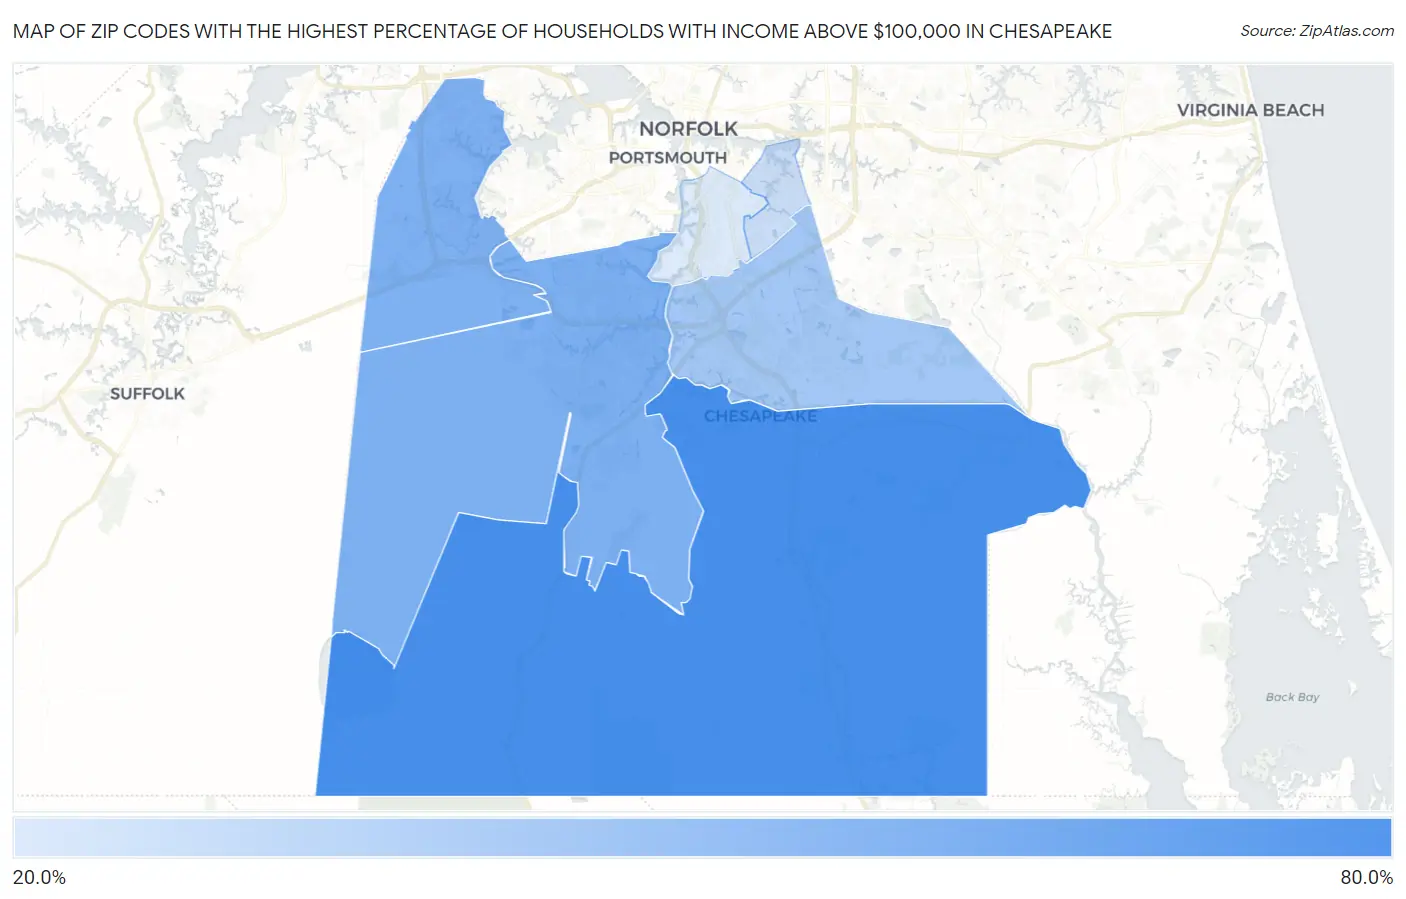
Map of Zip Codes with the Highest Percentage of Households with Income Above $100,000 in Chesapeake

0.0%
80.0%
Zip Codes with the Highest Percentage of Households with Income Above $100,000 in Chesapeake Map

Zip Codes with the Highest Percentage of Households with Income Above $100,000 in Chesapeake, VA

Zip Code Households with Income > $100k vs State vs National
1.2332265.1%44.1%(+21.0)#8437.3%(+27.8)#1,523
2.2332349.7%44.1%(+5.60)#19637.3%(+12.4)#4,947
3.2332148.8%44.1%(+4.70)#21037.3%(+11.5)#5,230
4.2332039.2%44.1%(-4.90)#30737.3%(+1.90)#9,310
5.2332529.4%44.1%(-14.7)#45837.3%(-7.90)#15,918
6.2332425.0%44.1%(-19.1)#54837.3%(-12.3)#19,747

Common Questions

What are the Top 5 Zip Codes with the Highest Percentage of Households with Income Above $100,000 in Chesapeake, VA?
Top 5 Zip Codes with the Highest Percentage of Households with Income Above $100,000 in Chesapeake, VA are:
#1
65.1%
#2
49.7%
#3
48.8%
#4
39.2%
#5
29.4%
What zip code has the Highest Percentage of Households with Income Above $100,000 in Chesapeake, VA?
23322 has the Highest Percentage of Households with Income Above $100,000 in Chesapeake, VA with 65.1%.
What is the Percentage of Households with Income Above $100,000 in Chesapeake, VA?
Percentage of Households with Income Above $100,000 in Chesapeake is 46.2%.
What is the Percentage of Households with Income Above $100,000 in Virginia?
Percentage of Households with Income Above $100,000 in Virginia is 44.1%.
What is the Percentage of Households with Income Above $100,000 in the United States?
Percentage of Households with Income Above $100,000 in the United States is 37.3%.