Zip Codes with the Highest Percentage of Households with Income Above $100,000 in Chesterfield, VA
RELATED REPORTS & OPTIONS
Household Income | $100k+
Chesterfield
Compare Zip Codes
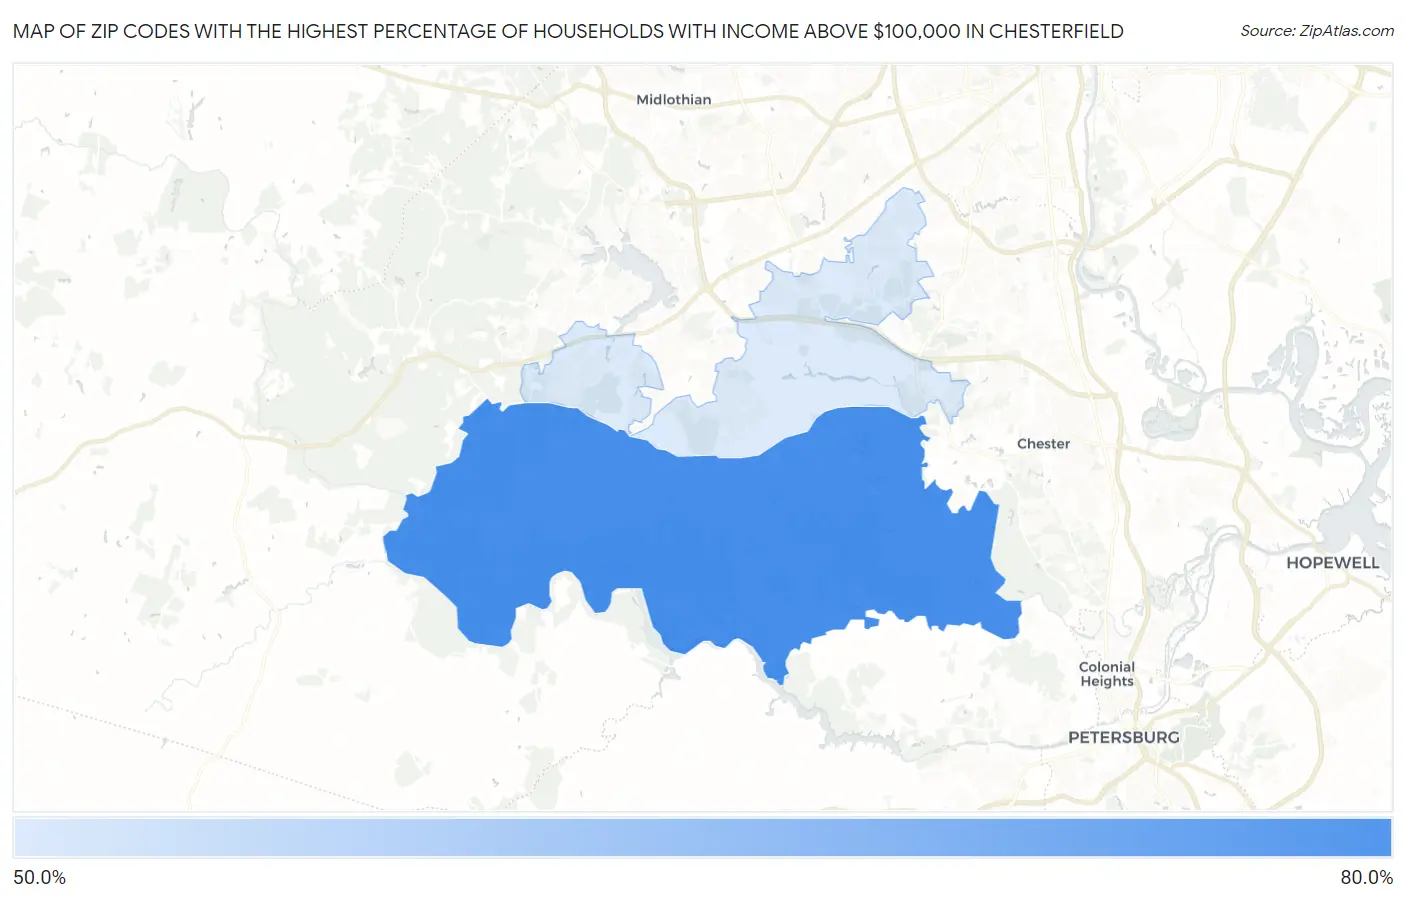
Map of Zip Codes with the Highest Percentage of Households with Income Above $100,000 in Chesterfield
50.7%
64.0%
Zip Codes with the Highest Percentage of Households with Income Above $100,000 in Chesterfield, VA
| Zip Code | Households with Income > $100k | vs State | vs National | |
| 1. | 23838 | 64.0% | 44.1%(+19.9)#93 | 37.3%(+26.7)#1,683 |
| 2. | 23832 | 50.7% | 44.1%(+6.60)#182 | 37.3%(+13.4)#4,624 |
1
Common Questions
What are the Top Zip Codes with the Highest Percentage of Households with Income Above $100,000 in Chesterfield, VA?
Top Zip Codes with the Highest Percentage of Households with Income Above $100,000 in Chesterfield, VA are:
What zip code has the Highest Percentage of Households with Income Above $100,000 in Chesterfield, VA?
23838 has the Highest Percentage of Households with Income Above $100,000 in Chesterfield, VA with 64.0%.
What is the Percentage of Households with Income Above $100,000 in Virginia?
Percentage of Households with Income Above $100,000 in Virginia is 44.1%.
What is the Percentage of Households with Income Above $100,000 in the United States?
Percentage of Households with Income Above $100,000 in the United States is 37.3%.