Zip Codes with the Highest Percentage of Population Employed in Health Diagnosing & Treating in Leesburg, VA
RELATED REPORTS & OPTIONS
Health Diagnosing & Treating
Leesburg
Compare Zip Codes
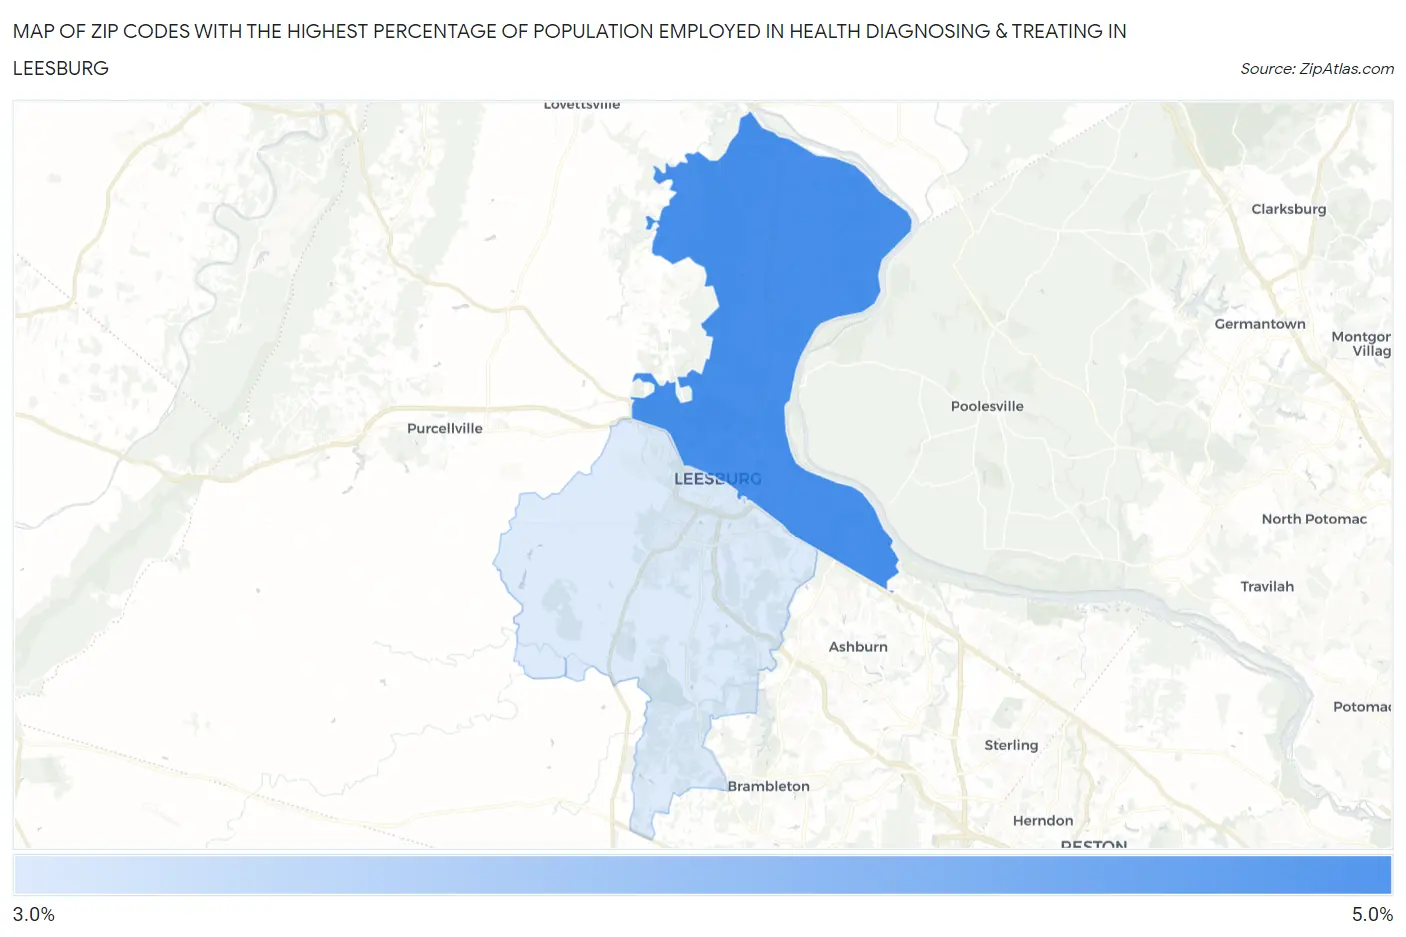
Map of Zip Codes with the Highest Percentage of Population Employed in Health Diagnosing & Treating in Leesburg
3.6%
4.3%
Zip Codes with the Highest Percentage of Population Employed in Health Diagnosing & Treating in Leesburg, VA
| Zip Code | % Employed | vs State | vs National | |
| 1. | 20176 | 4.3% | 5.7%(-1.35)#501 | 6.2%(-1.93)#20,305 |
| 2. | 20175 | 3.6% | 5.7%(-2.09)#583 | 6.2%(-2.68)#22,728 |
1
Common Questions
What are the Top Zip Codes with the Highest Percentage of Population Employed in Health Diagnosing & Treating in Leesburg, VA?
Top Zip Codes with the Highest Percentage of Population Employed in Health Diagnosing & Treating in Leesburg, VA are:
What zip code has the Highest Percentage of Population Employed in Health Diagnosing & Treating in Leesburg, VA?
20176 has the Highest Percentage of Population Employed in Health Diagnosing & Treating in Leesburg, VA with 4.3%.
What is the Percentage of Population Employed in Health Diagnosing & Treating in Leesburg, VA?
Percentage of Population Employed in Health Diagnosing & Treating in Leesburg is 3.7%.
What is the Percentage of Population Employed in Health Diagnosing & Treating in Virginia?
Percentage of Population Employed in Health Diagnosing & Treating in Virginia is 5.7%.
What is the Percentage of Population Employed in Health Diagnosing & Treating in the United States?
Percentage of Population Employed in Health Diagnosing & Treating in the United States is 6.2%.