Zip Codes with the Highest Percentage of Population Employed in Health Diagnosing & Treating in Suffolk, VA
RELATED REPORTS & OPTIONS
Health Diagnosing & Treating
Suffolk
Compare Zip Codes
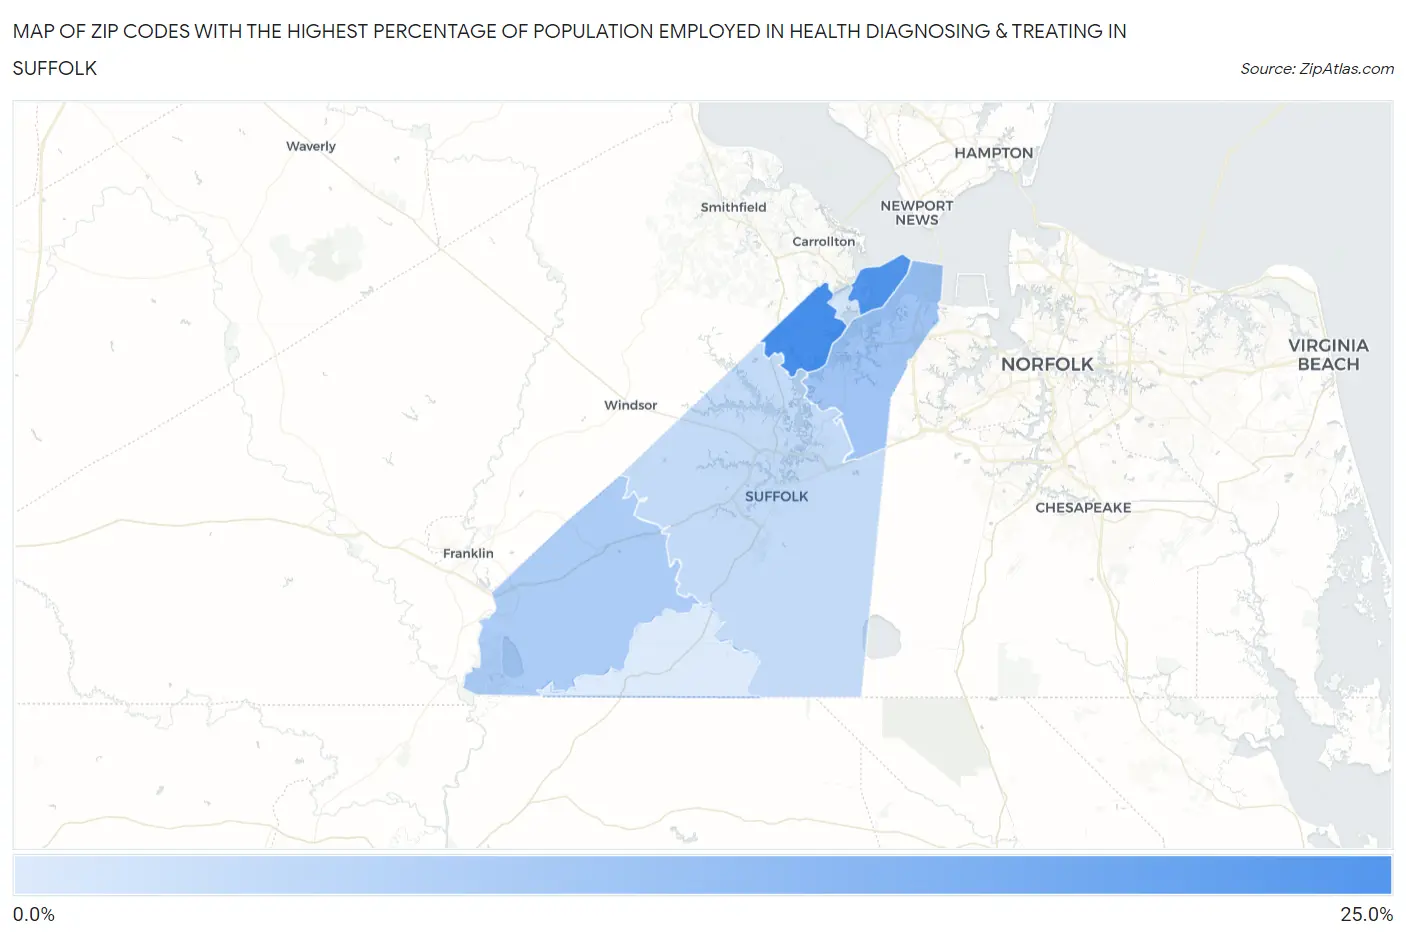
Map of Zip Codes with the Highest Percentage of Population Employed in Health Diagnosing & Treating in Suffolk
1.6%
22.5%
Zip Codes with the Highest Percentage of Population Employed in Health Diagnosing & Treating in Suffolk, VA
| Zip Code | % Employed | vs State | vs National | |
| 1. | 23432 | 22.5% | 5.7%(+16.9)#12 | 6.2%(+16.3)#409 |
| 2. | 23433 | 20.5% | 5.7%(+14.8)#18 | 6.2%(+14.2)#518 |
| 3. | 23435 | 9.7% | 5.7%(+4.02)#117 | 6.2%(+3.43)#4,279 |
| 4. | 23437 | 8.0% | 5.7%(+2.37)#191 | 6.2%(+1.78)#7,431 |
| 5. | 23434 | 4.9% | 5.7%(-0.774)#435 | 6.2%(-1.36)#18,159 |
| 6. | 23436 | 2.6% | 5.7%(-3.06)#653 | 6.2%(-3.65)#25,285 |
| 7. | 23438 | 1.6% | 5.7%(-4.02)#697 | 6.2%(-4.61)#27,029 |
1
Common Questions
What are the Top 5 Zip Codes with the Highest Percentage of Population Employed in Health Diagnosing & Treating in Suffolk, VA?
Top 5 Zip Codes with the Highest Percentage of Population Employed in Health Diagnosing & Treating in Suffolk, VA are:
What zip code has the Highest Percentage of Population Employed in Health Diagnosing & Treating in Suffolk, VA?
23432 has the Highest Percentage of Population Employed in Health Diagnosing & Treating in Suffolk, VA with 22.5%.
What is the Percentage of Population Employed in Health Diagnosing & Treating in Suffolk, VA?
Percentage of Population Employed in Health Diagnosing & Treating in Suffolk is 7.2%.
What is the Percentage of Population Employed in Health Diagnosing & Treating in Virginia?
Percentage of Population Employed in Health Diagnosing & Treating in Virginia is 5.7%.
What is the Percentage of Population Employed in Health Diagnosing & Treating in the United States?
Percentage of Population Employed in Health Diagnosing & Treating in the United States is 6.2%.