Zip Codes with the Highest Percentage of Population Employed in Health Diagnosing & Treating in Falls Church, VA
RELATED REPORTS & OPTIONS
Health Diagnosing & Treating
Falls Church
Compare Zip Codes
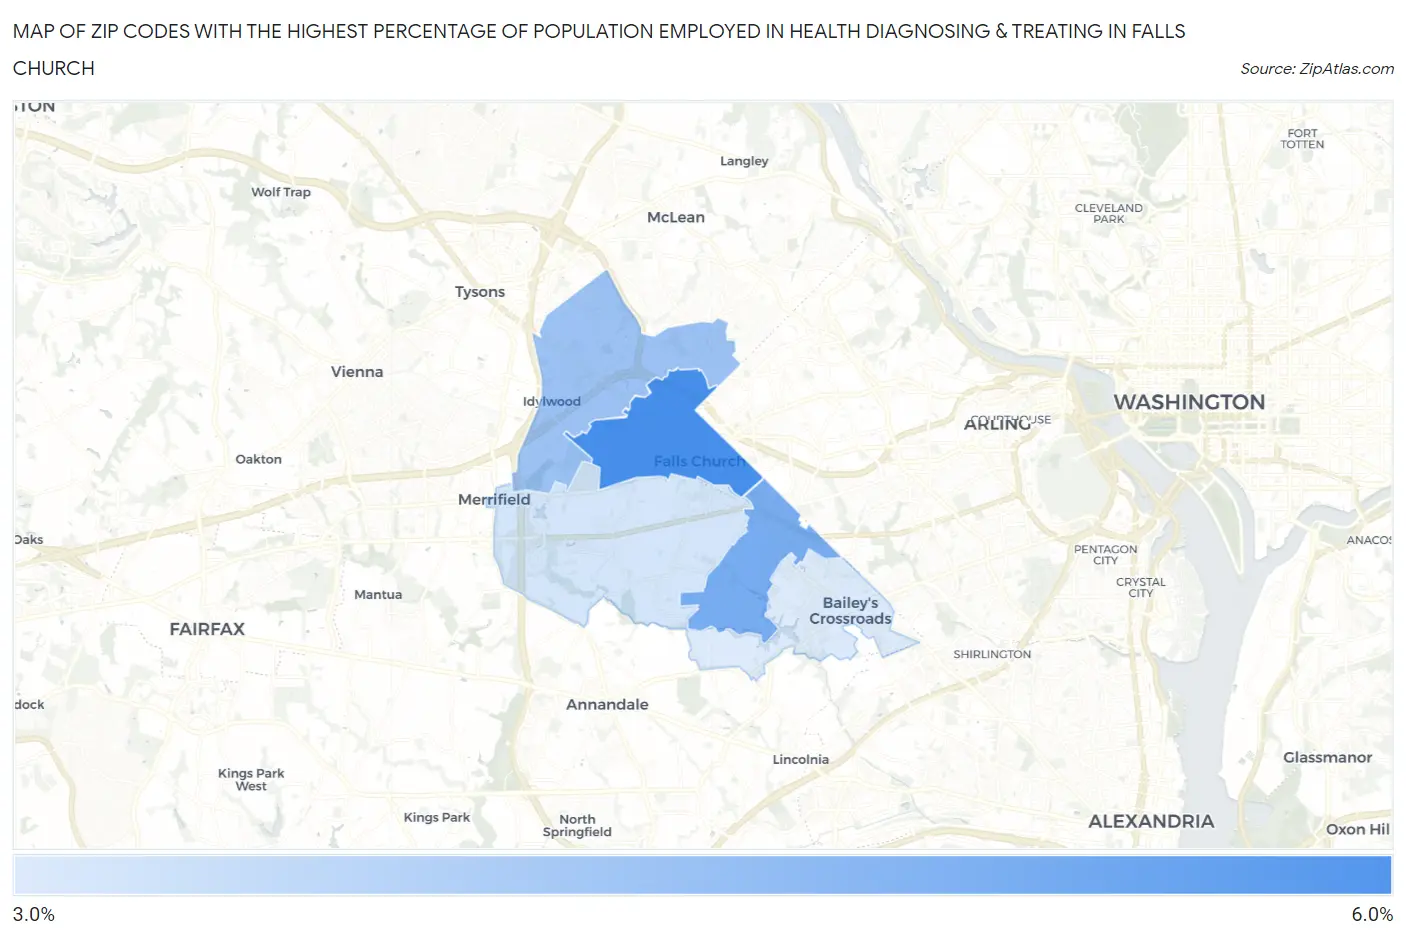
Map of Zip Codes with the Highest Percentage of Population Employed in Health Diagnosing & Treating in Falls Church
3.3%
5.9%
Zip Codes with the Highest Percentage of Population Employed in Health Diagnosing & Treating in Falls Church, VA
| Zip Code | % Employed | vs State | vs National | |
| 1. | 22046 | 5.9% | 5.7%(+0.258)#339 | 6.2%(-0.330)#14,172 |
| 2. | 22044 | 5.1% | 5.7%(-0.603)#418 | 6.2%(-1.19)#17,478 |
| 3. | 22043 | 4.4% | 5.7%(-1.22)#489 | 6.2%(-1.81)#19,894 |
| 4. | 22042 | 3.5% | 5.7%(-2.20)#591 | 6.2%(-2.79)#23,034 |
| 5. | 22041 | 3.3% | 5.7%(-2.37)#605 | 6.2%(-2.96)#23,533 |
1
Common Questions
What are the Top 3 Zip Codes with the Highest Percentage of Population Employed in Health Diagnosing & Treating in Falls Church, VA?
Top 3 Zip Codes with the Highest Percentage of Population Employed in Health Diagnosing & Treating in Falls Church, VA are:
What zip code has the Highest Percentage of Population Employed in Health Diagnosing & Treating in Falls Church, VA?
22046 has the Highest Percentage of Population Employed in Health Diagnosing & Treating in Falls Church, VA with 5.9%.
What is the Percentage of Population Employed in Health Diagnosing & Treating in Falls Church, VA?
Percentage of Population Employed in Health Diagnosing & Treating in Falls Church is 5.5%.
What is the Percentage of Population Employed in Health Diagnosing & Treating in Virginia?
Percentage of Population Employed in Health Diagnosing & Treating in Virginia is 5.7%.
What is the Percentage of Population Employed in Health Diagnosing & Treating in the United States?
Percentage of Population Employed in Health Diagnosing & Treating in the United States is 6.2%.