Zip Codes with the Highest Percentage of Population with a Degree in Visual and Performing Arts in Springfield, VA
RELATED REPORTS & OPTIONS
Visual and Performing Arts
Springfield
Compare Zip Codes
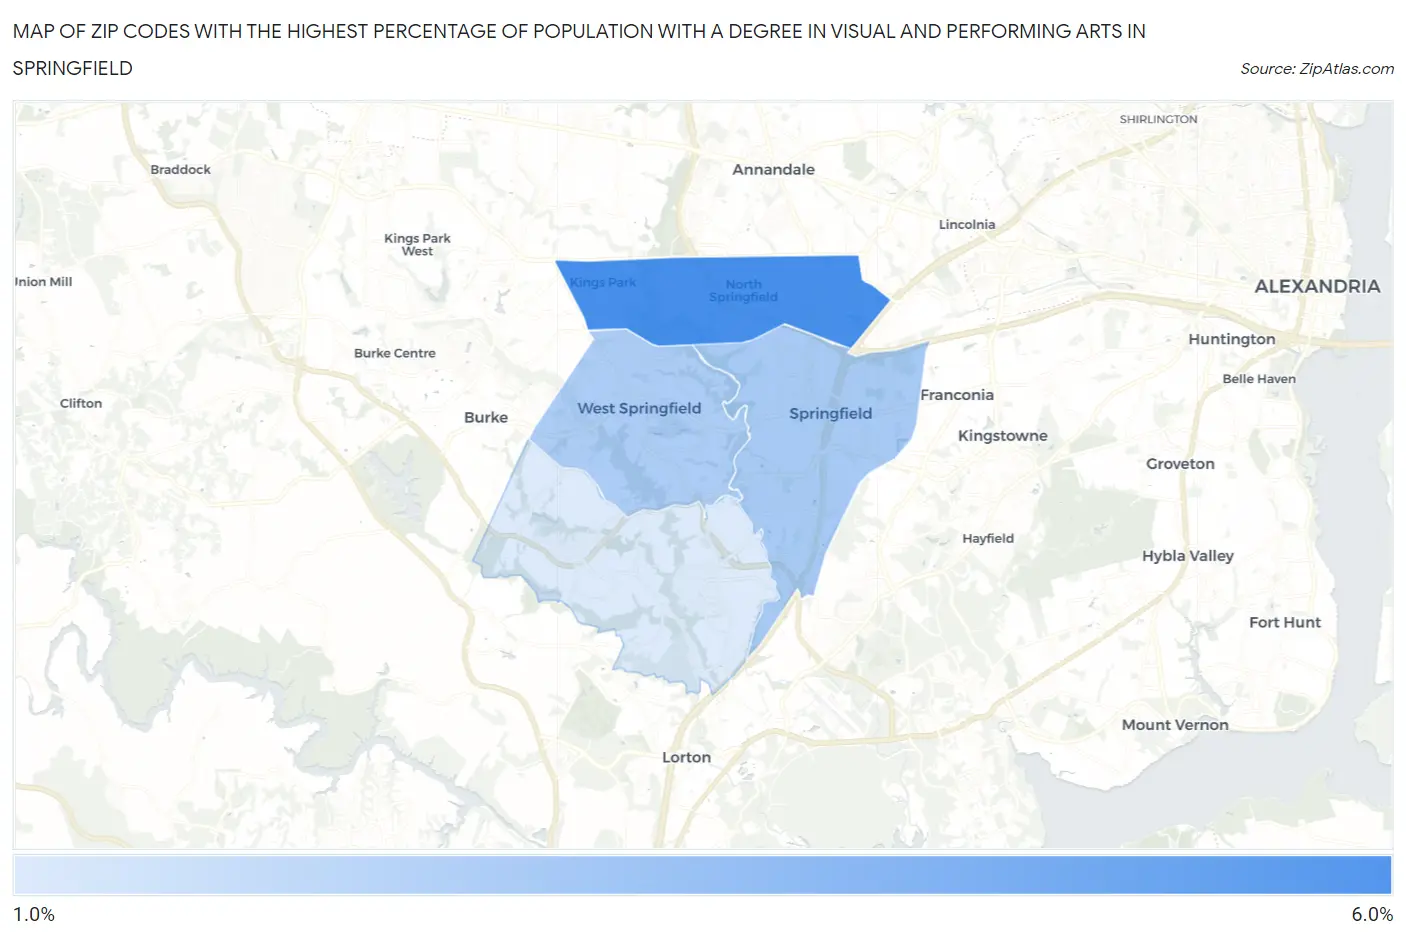
Map of Zip Codes with the Highest Percentage of Population with a Degree in Visual and Performing Arts in Springfield
1.7%
5.3%
Zip Codes with the Highest Percentage of Population with a Degree in Visual and Performing Arts in Springfield, VA
| Zip Code | % Graduates | vs State | vs National | |
| 1. | 22151 | 5.3% | 3.7%(+1.56)#159 | 4.3%(+1.02)#6,099 |
| 2. | 22150 | 3.0% | 3.7%(-0.751)#347 | 4.3%(-1.29)#12,851 |
| 3. | 22152 | 2.8% | 3.7%(-0.867)#362 | 4.3%(-1.40)#13,302 |
| 4. | 22153 | 1.7% | 3.7%(-2.03)#484 | 4.3%(-2.56)#17,526 |
1
Common Questions
What are the Top 3 Zip Codes with the Highest Percentage of Population with a Degree in Visual and Performing Arts in Springfield, VA?
Top 3 Zip Codes with the Highest Percentage of Population with a Degree in Visual and Performing Arts in Springfield, VA are:
What zip code has the Highest Percentage of Population with a Degree in Visual and Performing Arts in Springfield, VA?
22151 has the Highest Percentage of Population with a Degree in Visual and Performing Arts in Springfield, VA with 5.3%.
What is the Percentage of Population with a Degree in Visual and Performing Arts in Springfield, VA?
Percentage of Population with a Degree in Visual and Performing Arts in Springfield is 3.1%.
What is the Percentage of Population with a Degree in Visual and Performing Arts in Virginia?
Percentage of Population with a Degree in Visual and Performing Arts in Virginia is 3.7%.
What is the Percentage of Population with a Degree in Visual and Performing Arts in the United States?
Percentage of Population with a Degree in Visual and Performing Arts in the United States is 4.3%.