Zip Codes with the Highest Percentage of Population with a Degree in Visual and Performing Arts in Winchester, VA
RELATED REPORTS & OPTIONS
Visual and Performing Arts
Winchester
Compare Zip Codes
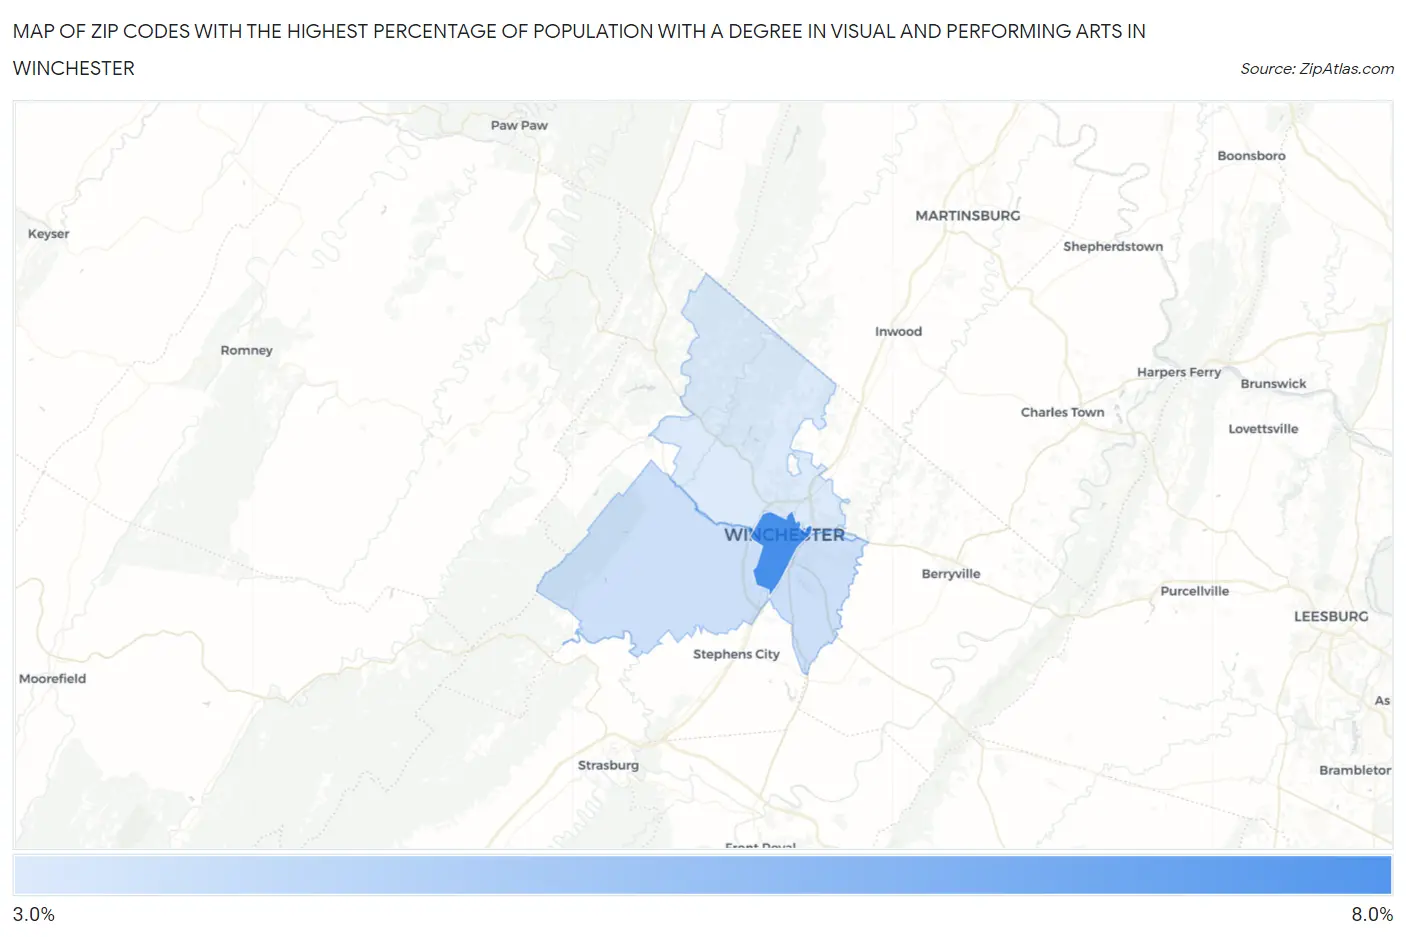
Map of Zip Codes with the Highest Percentage of Population with a Degree in Visual and Performing Arts in Winchester
3.5%
6.9%
Zip Codes with the Highest Percentage of Population with a Degree in Visual and Performing Arts in Winchester, VA
| Zip Code | % Graduates | vs State | vs National | |
| 1. | 22601 | 6.9% | 3.7%(+3.15)#103 | 4.3%(+2.61)#3,797 |
| 2. | 22602 | 3.8% | 3.7%(+0.076)#256 | 4.3%(-0.459)#9,875 |
| 3. | 22603 | 3.5% | 3.7%(-0.265)#296 | 4.3%(-0.800)#11,069 |
1
Common Questions
What are the Top Zip Codes with the Highest Percentage of Population with a Degree in Visual and Performing Arts in Winchester, VA?
Top Zip Codes with the Highest Percentage of Population with a Degree in Visual and Performing Arts in Winchester, VA are:
What zip code has the Highest Percentage of Population with a Degree in Visual and Performing Arts in Winchester, VA?
22601 has the Highest Percentage of Population with a Degree in Visual and Performing Arts in Winchester, VA with 6.9%.
What is the Percentage of Population with a Degree in Visual and Performing Arts in Winchester, VA?
Percentage of Population with a Degree in Visual and Performing Arts in Winchester is 6.8%.
What is the Percentage of Population with a Degree in Visual and Performing Arts in Virginia?
Percentage of Population with a Degree in Visual and Performing Arts in Virginia is 3.7%.
What is the Percentage of Population with a Degree in Visual and Performing Arts in the United States?
Percentage of Population with a Degree in Visual and Performing Arts in the United States is 4.3%.