Zip Codes with the Highest Percentage of Population with a Degree in Visual and Performing Arts in Reston, VA
RELATED REPORTS & OPTIONS
Visual and Performing Arts
Reston
Compare Zip Codes
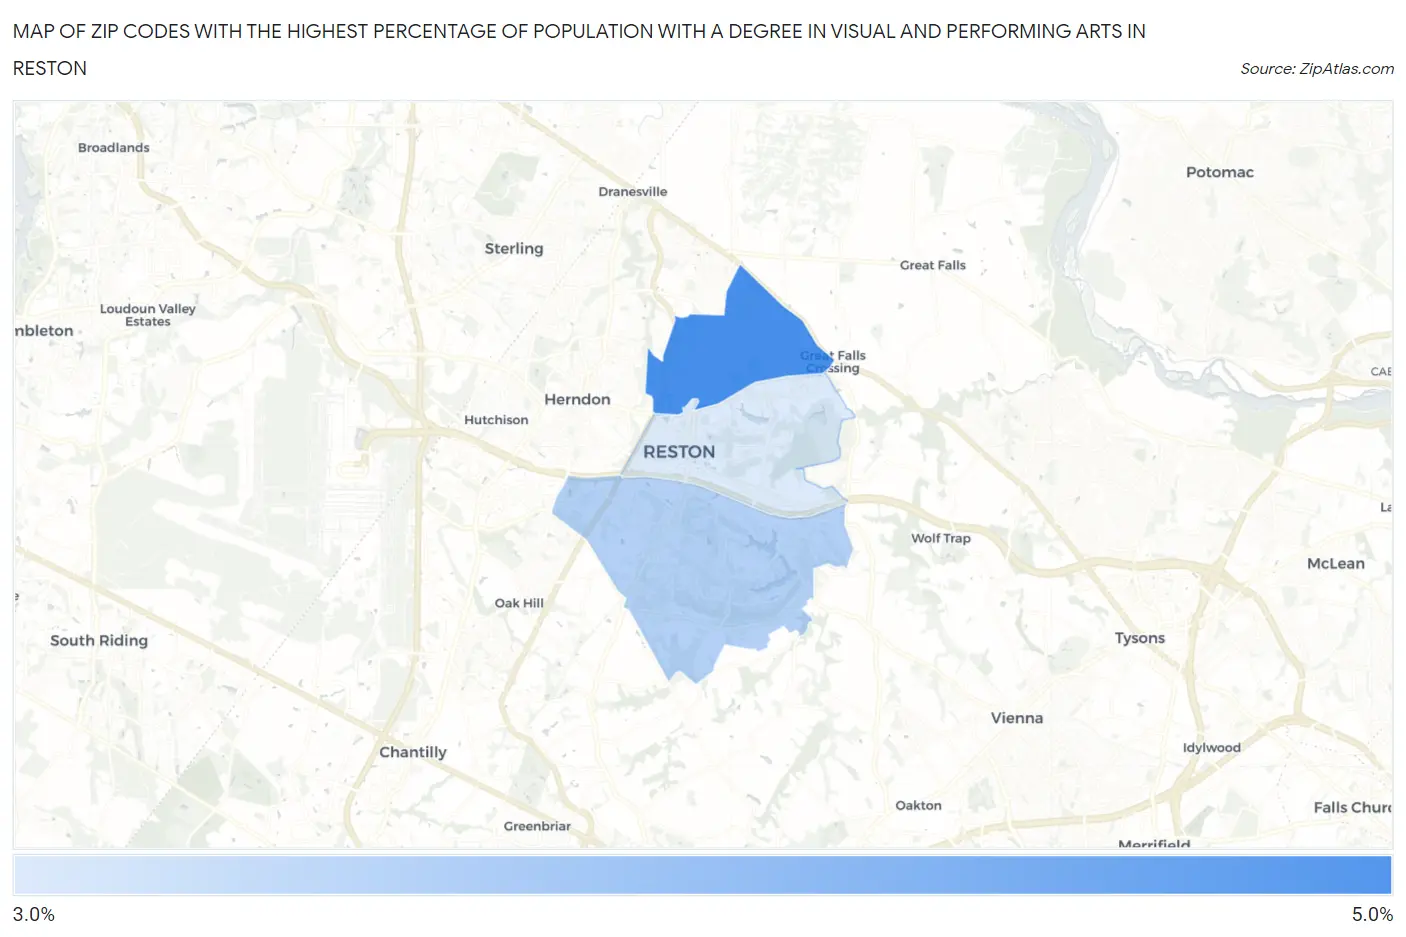
Map of Zip Codes with the Highest Percentage of Population with a Degree in Visual and Performing Arts in Reston
3.5%
4.5%
Zip Codes with the Highest Percentage of Population with a Degree in Visual and Performing Arts in Reston, VA
| Zip Code | % Graduates | vs State | vs National | |
| 1. | 20194 | 4.5% | 3.7%(+0.812)#195 | 4.3%(+0.277)#7,735 |
| 2. | 20191 | 3.8% | 3.7%(+0.054)#257 | 4.3%(-0.481)#9,940 |
| 3. | 20190 | 3.5% | 3.7%(-0.238)#290 | 4.3%(-0.773)#10,954 |
1
Common Questions
What are the Top Zip Codes with the Highest Percentage of Population with a Degree in Visual and Performing Arts in Reston, VA?
Top Zip Codes with the Highest Percentage of Population with a Degree in Visual and Performing Arts in Reston, VA are:
What zip code has the Highest Percentage of Population with a Degree in Visual and Performing Arts in Reston, VA?
20194 has the Highest Percentage of Population with a Degree in Visual and Performing Arts in Reston, VA with 4.5%.
What is the Percentage of Population with a Degree in Visual and Performing Arts in Reston, VA?
Percentage of Population with a Degree in Visual and Performing Arts in Reston is 3.8%.
What is the Percentage of Population with a Degree in Visual and Performing Arts in Virginia?
Percentage of Population with a Degree in Visual and Performing Arts in Virginia is 3.7%.
What is the Percentage of Population with a Degree in Visual and Performing Arts in the United States?
Percentage of Population with a Degree in Visual and Performing Arts in the United States is 4.3%.