Zip Codes with the Highest Percentage of Population with a Degree in Visual and Performing Arts in Sterling, VA
RELATED REPORTS & OPTIONS
Visual and Performing Arts
Sterling
Compare Zip Codes
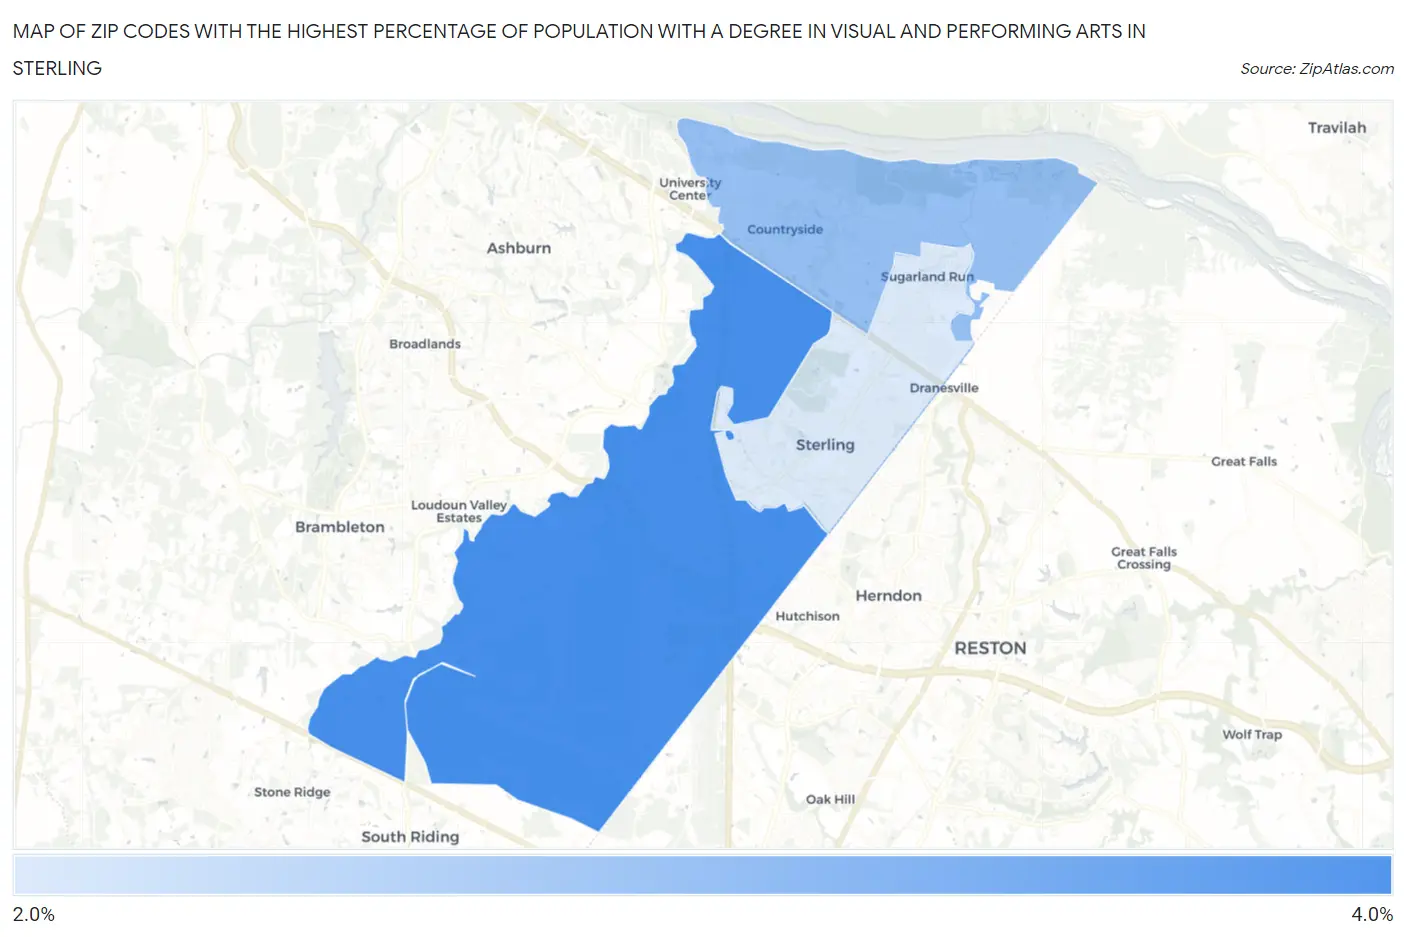
Map of Zip Codes with the Highest Percentage of Population with a Degree in Visual and Performing Arts in Sterling
2.7%
3.5%
Zip Codes with the Highest Percentage of Population with a Degree in Visual and Performing Arts in Sterling, VA
| Zip Code | % Graduates | vs State | vs National | |
| 1. | 20166 | 3.5% | 3.7%(-0.225)#288 | 4.3%(-0.760)#10,909 |
| 2. | 20165 | 3.1% | 3.7%(-0.619)#331 | 4.3%(-1.15)#12,346 |
| 3. | 20164 | 2.7% | 3.7%(-0.989)#380 | 4.3%(-1.52)#13,782 |
1
Common Questions
What are the Top Zip Codes with the Highest Percentage of Population with a Degree in Visual and Performing Arts in Sterling, VA?
Top Zip Codes with the Highest Percentage of Population with a Degree in Visual and Performing Arts in Sterling, VA are:
What zip code has the Highest Percentage of Population with a Degree in Visual and Performing Arts in Sterling, VA?
20166 has the Highest Percentage of Population with a Degree in Visual and Performing Arts in Sterling, VA with 3.5%.
What is the Percentage of Population with a Degree in Visual and Performing Arts in Sterling, VA?
Percentage of Population with a Degree in Visual and Performing Arts in Sterling is 2.1%.
What is the Percentage of Population with a Degree in Visual and Performing Arts in Virginia?
Percentage of Population with a Degree in Visual and Performing Arts in Virginia is 3.7%.
What is the Percentage of Population with a Degree in Visual and Performing Arts in the United States?
Percentage of Population with a Degree in Visual and Performing Arts in the United States is 4.3%.