Zip Codes with the Highest Percentage of Population Employed in Food Preparation & Serving in Charlottesville, VA
RELATED REPORTS & OPTIONS
Food Preparation & Serving
Charlottesville
Compare Zip Codes
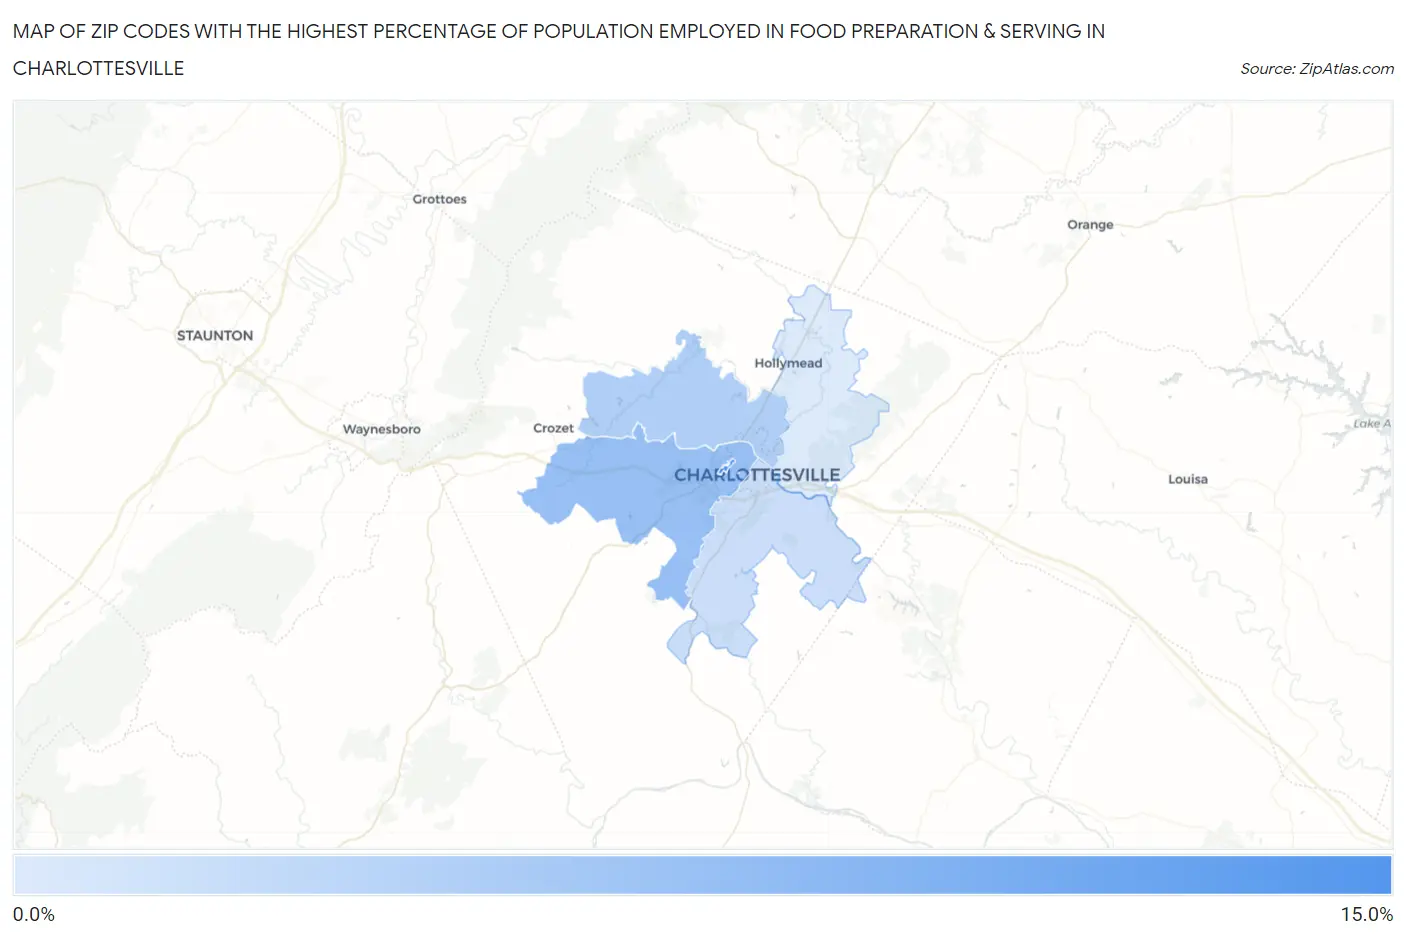
Map of Zip Codes with the Highest Percentage of Population Employed in Food Preparation & Serving in Charlottesville
2.4%
14.1%
Zip Codes with the Highest Percentage of Population Employed in Food Preparation & Serving in Charlottesville, VA
| Zip Code | % Employed | vs State | vs National | |
| 1. | 22904 | 14.1% | 4.8%(+9.28)#38 | 5.3%(+8.78)#1,150 |
| 2. | 22903 | 7.6% | 4.8%(+2.84)#129 | 5.3%(+2.34)#5,330 |
| 3. | 22901 | 5.6% | 4.8%(+0.834)#238 | 5.3%(+0.335)#10,639 |
| 4. | 22902 | 3.7% | 4.8%(-1.07)#432 | 5.3%(-1.57)#18,285 |
| 5. | 22911 | 2.4% | 4.8%(-2.42)#581 | 5.3%(-2.92)#23,549 |
1
Common Questions
What are the Top 3 Zip Codes with the Highest Percentage of Population Employed in Food Preparation & Serving in Charlottesville, VA?
Top 3 Zip Codes with the Highest Percentage of Population Employed in Food Preparation & Serving in Charlottesville, VA are:
What zip code has the Highest Percentage of Population Employed in Food Preparation & Serving in Charlottesville, VA?
22904 has the Highest Percentage of Population Employed in Food Preparation & Serving in Charlottesville, VA with 14.1%.
What is the Percentage of Population Employed in Food Preparation & Serving in Charlottesville, VA?
Percentage of Population Employed in Food Preparation & Serving in Charlottesville is 6.9%.
What is the Percentage of Population Employed in Food Preparation & Serving in Virginia?
Percentage of Population Employed in Food Preparation & Serving in Virginia is 4.8%.
What is the Percentage of Population Employed in Food Preparation & Serving in the United States?
Percentage of Population Employed in Food Preparation & Serving in the United States is 5.3%.