Zip Codes with the Highest Percentage of Population Employed in Food Preparation & Serving in Centreville, VA
RELATED REPORTS & OPTIONS
Food Preparation & Serving
Centreville
Compare Zip Codes
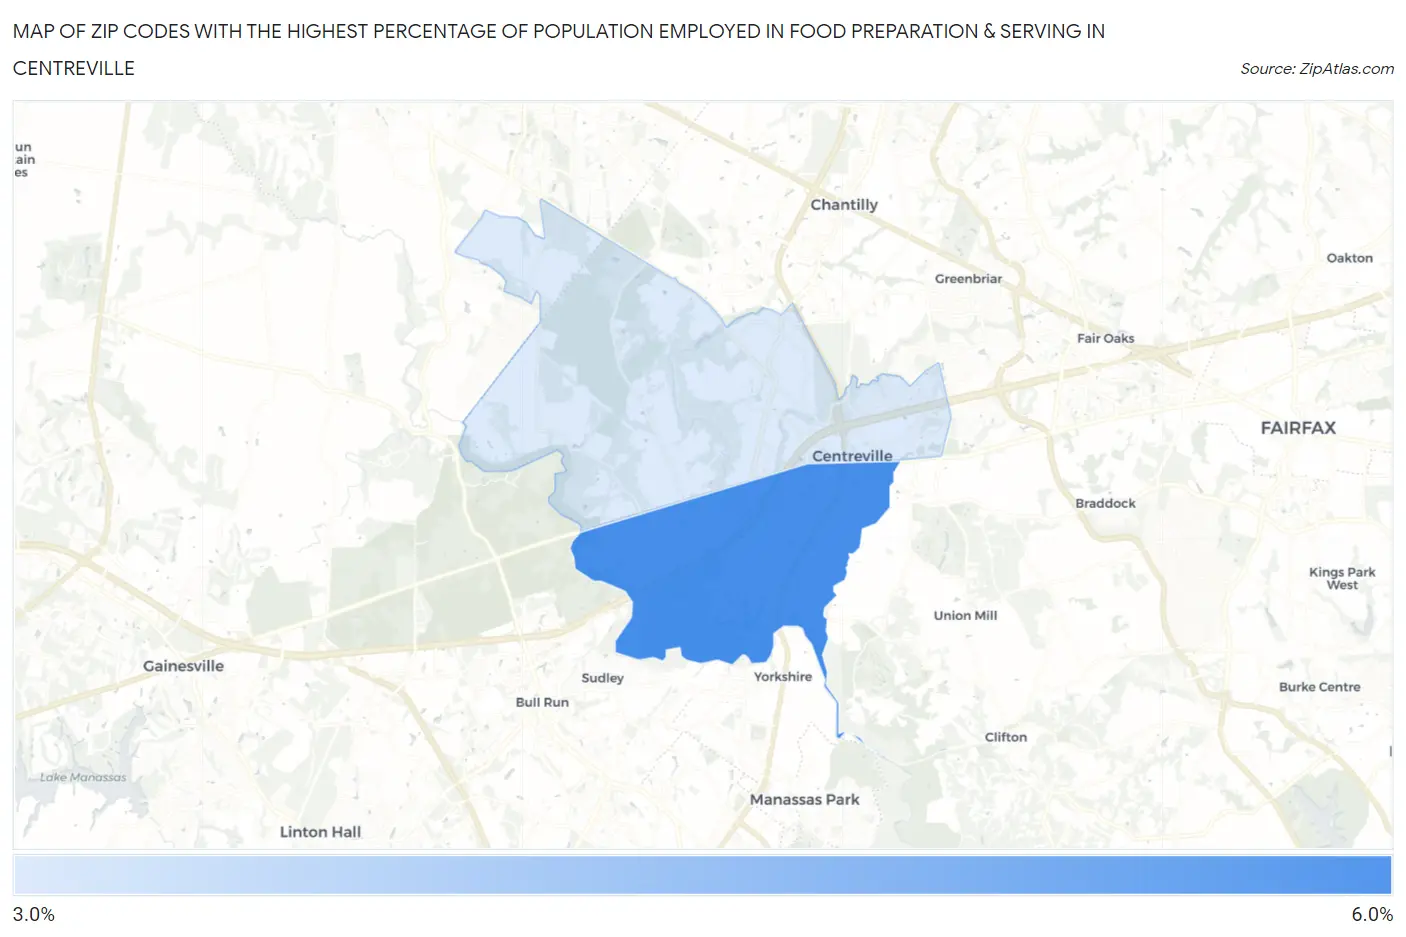
Map of Zip Codes with the Highest Percentage of Population Employed in Food Preparation & Serving in Centreville
3.6%
5.2%
Zip Codes with the Highest Percentage of Population Employed in Food Preparation & Serving in Centreville, VA
| Zip Code | % Employed | vs State | vs National | |
| 1. | 20121 | 5.2% | 4.8%(+0.369)#276 | 5.3%(-0.130)#12,338 |
| 2. | 20120 | 3.6% | 4.8%(-1.14)#444 | 5.3%(-1.64)#18,588 |
1
Common Questions
What are the Top Zip Codes with the Highest Percentage of Population Employed in Food Preparation & Serving in Centreville, VA?
Top Zip Codes with the Highest Percentage of Population Employed in Food Preparation & Serving in Centreville, VA are:
What zip code has the Highest Percentage of Population Employed in Food Preparation & Serving in Centreville, VA?
20121 has the Highest Percentage of Population Employed in Food Preparation & Serving in Centreville, VA with 5.2%.
What is the Percentage of Population Employed in Food Preparation & Serving in Centreville, VA?
Percentage of Population Employed in Food Preparation & Serving in Centreville is 4.1%.
What is the Percentage of Population Employed in Food Preparation & Serving in Virginia?
Percentage of Population Employed in Food Preparation & Serving in Virginia is 4.8%.
What is the Percentage of Population Employed in Food Preparation & Serving in the United States?
Percentage of Population Employed in Food Preparation & Serving in the United States is 5.3%.