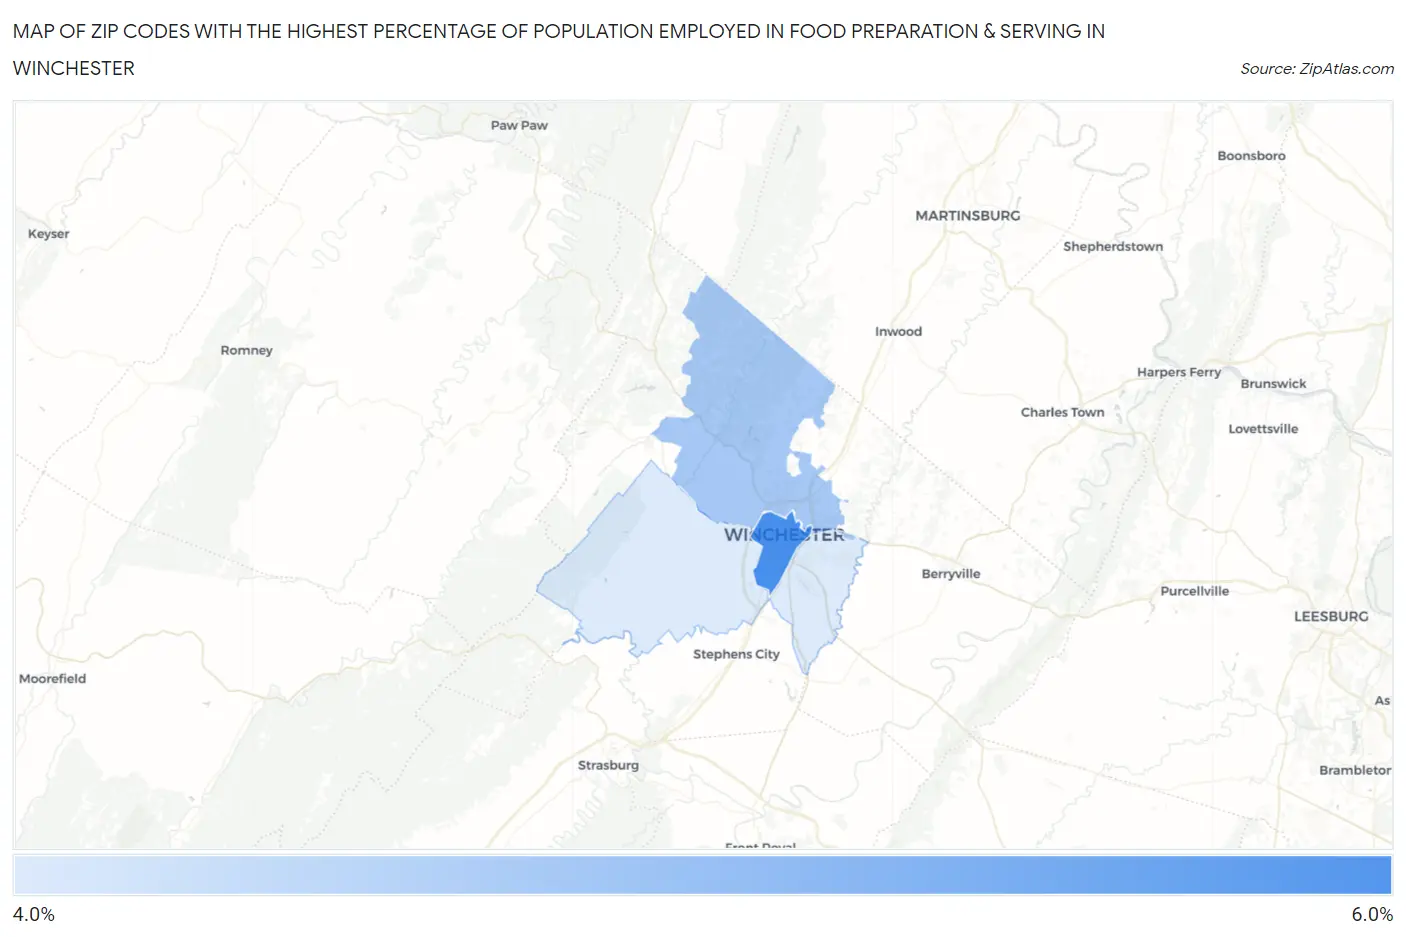
Zip Codes with the Highest Percentage of Population Employed in Food Preparation & Serving in Winchester, VA
RELATED REPORTS & OPTIONS
Food Preparation & Serving
Winchester
Compare Zip Codes
Map of Zip Codes with the Highest Percentage of Population Employed in Food Preparation & Serving in Winchester
4.4%
5.3%
Zip Codes with the Highest Percentage of Population Employed in Food Preparation & Serving in Winchester, VA
| Zip Code | % Employed | vs State | vs National | |
| 1. | 22601 | 5.3% | 4.8%(+0.561)#258 | 5.3%(+0.062)#11,591 |
| 2. | 22603 | 4.7% | 4.8%(-0.040)#316 | 5.3%(-0.539)#13,963 |
| 3. | 22602 | 4.4% | 4.8%(-0.393)#356 | 5.3%(-0.892)#15,447 |
1
Common Questions
What are the Top Zip Codes with the Highest Percentage of Population Employed in Food Preparation & Serving in Winchester, VA?
Top Zip Codes with the Highest Percentage of Population Employed in Food Preparation & Serving in Winchester, VA are:
What zip code has the Highest Percentage of Population Employed in Food Preparation & Serving in Winchester, VA?
22601 has the Highest Percentage of Population Employed in Food Preparation & Serving in Winchester, VA with 5.3%.
What is the Percentage of Population Employed in Food Preparation & Serving in Winchester, VA?
Percentage of Population Employed in Food Preparation & Serving in Winchester is 5.5%.
What is the Percentage of Population Employed in Food Preparation & Serving in Virginia?
Percentage of Population Employed in Food Preparation & Serving in Virginia is 4.8%.
What is the Percentage of Population Employed in Food Preparation & Serving in the United States?
Percentage of Population Employed in Food Preparation & Serving in the United States is 5.3%.