Zip Codes with the Highest Percentage of Population Employed in Food Preparation & Serving in Yorktown, VA
RELATED REPORTS & OPTIONS
Food Preparation & Serving
Yorktown
Compare Zip Codes
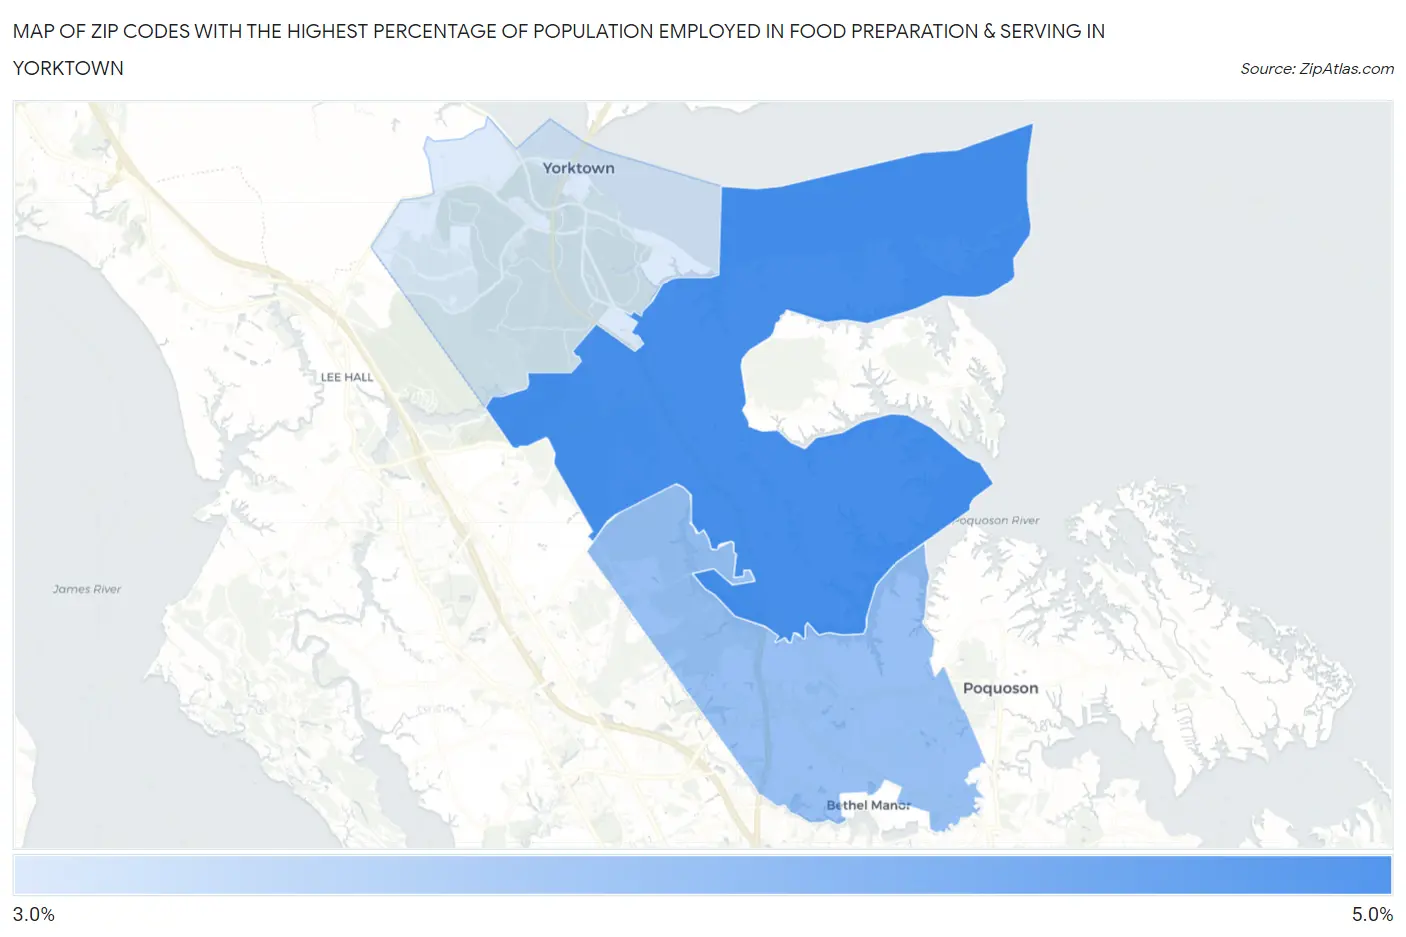
Map of Zip Codes with the Highest Percentage of Population Employed in Food Preparation & Serving in Yorktown
3.4%
4.7%
Zip Codes with the Highest Percentage of Population Employed in Food Preparation & Serving in Yorktown, VA
| Zip Code | % Employed | vs State | vs National | |
| 1. | 23692 | 4.7% | 4.8%(-0.121)#326 | 5.3%(-0.621)#14,302 |
| 2. | 23693 | 4.0% | 4.8%(-0.806)#403 | 5.3%(-1.31)#17,202 |
| 3. | 23690 | 3.4% | 4.8%(-1.37)#473 | 5.3%(-1.87)#19,568 |
1
Common Questions
What are the Top Zip Codes with the Highest Percentage of Population Employed in Food Preparation & Serving in Yorktown, VA?
Top Zip Codes with the Highest Percentage of Population Employed in Food Preparation & Serving in Yorktown, VA are:
What zip code has the Highest Percentage of Population Employed in Food Preparation & Serving in Yorktown, VA?
23692 has the Highest Percentage of Population Employed in Food Preparation & Serving in Yorktown, VA with 4.7%.
What is the Percentage of Population Employed in Food Preparation & Serving in Virginia?
Percentage of Population Employed in Food Preparation & Serving in Virginia is 4.8%.
What is the Percentage of Population Employed in Food Preparation & Serving in the United States?
Percentage of Population Employed in Food Preparation & Serving in the United States is 5.3%.