Zip Codes with the Highest Percentage of Population Employed in Food Preparation & Serving in Newport News, VA
RELATED REPORTS & OPTIONS
Food Preparation & Serving
Newport News
Compare Zip Codes
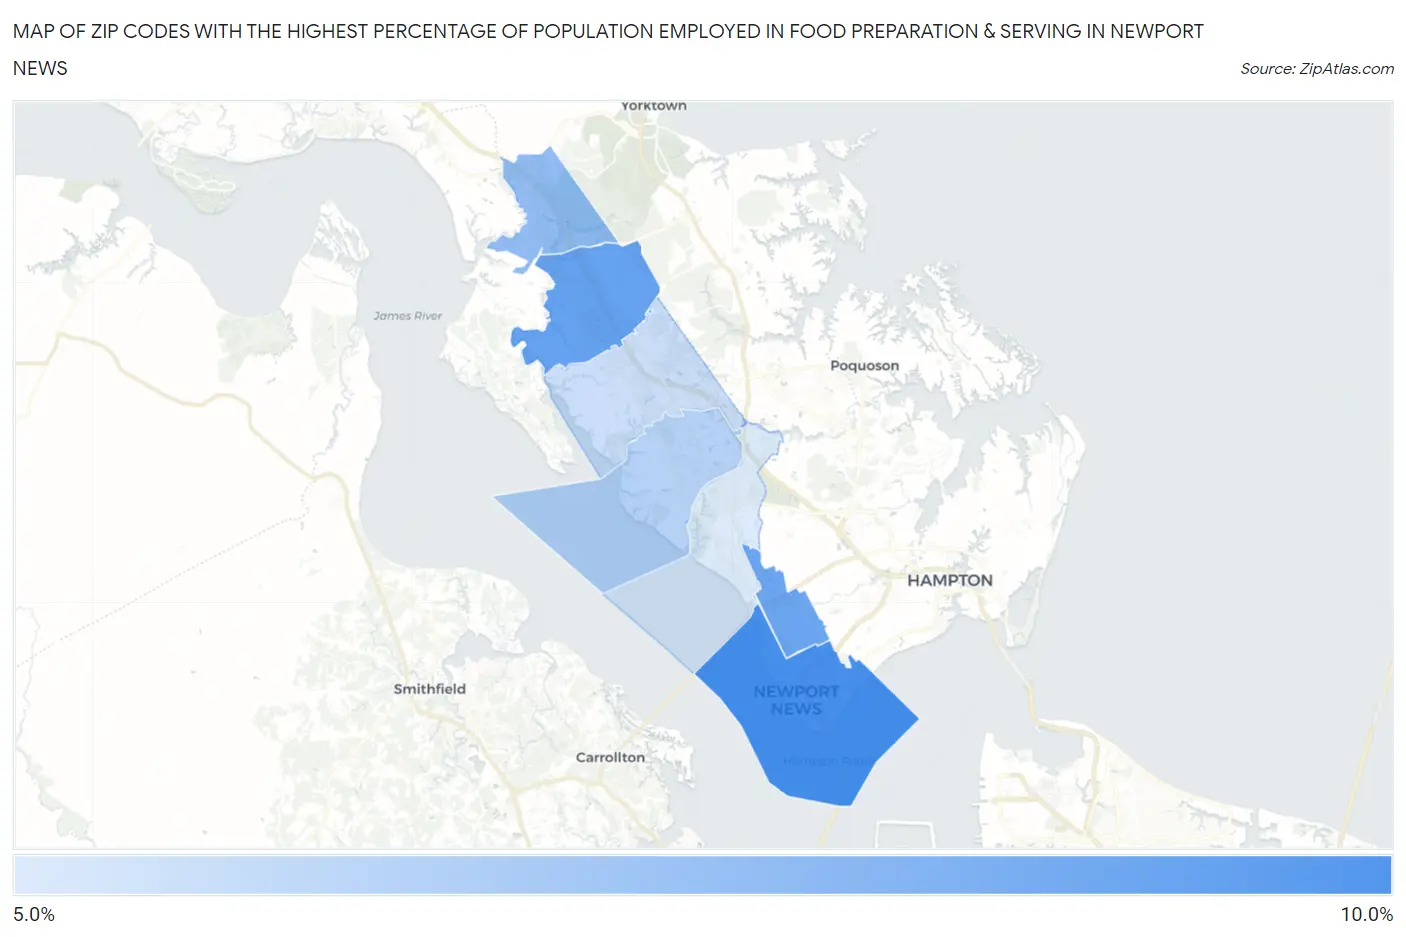
Map of Zip Codes with the Highest Percentage of Population Employed in Food Preparation & Serving in Newport News
5.1%
9.0%
Zip Codes with the Highest Percentage of Population Employed in Food Preparation & Serving in Newport News, VA
| Zip Code | % Employed | vs State | vs National | |
| 1. | 23607 | 9.0% | 4.8%(+4.18)#97 | 5.3%(+3.68)#3,557 |
| 2. | 23608 | 8.2% | 4.8%(+3.39)#117 | 5.3%(+2.89)#4,465 |
| 3. | 23605 | 8.0% | 4.8%(+3.20)#122 | 5.3%(+2.70)#4,744 |
| 4. | 23603 | 7.0% | 4.8%(+2.24)#149 | 5.3%(+1.74)#6,489 |
| 5. | 23606 | 6.1% | 4.8%(+1.28)#206 | 5.3%(+0.776)#9,134 |
| 6. | 23602 | 5.5% | 4.8%(+0.762)#242 | 5.3%(+0.262)#10,901 |
| 7. | 23601 | 5.1% | 4.8%(+0.284)#283 | 5.3%(-0.216)#12,650 |
1
Common Questions
What are the Top 5 Zip Codes with the Highest Percentage of Population Employed in Food Preparation & Serving in Newport News, VA?
Top 5 Zip Codes with the Highest Percentage of Population Employed in Food Preparation & Serving in Newport News, VA are:
What zip code has the Highest Percentage of Population Employed in Food Preparation & Serving in Newport News, VA?
23607 has the Highest Percentage of Population Employed in Food Preparation & Serving in Newport News, VA with 9.0%.
What is the Percentage of Population Employed in Food Preparation & Serving in Newport News, VA?
Percentage of Population Employed in Food Preparation & Serving in Newport News is 6.7%.
What is the Percentage of Population Employed in Food Preparation & Serving in Virginia?
Percentage of Population Employed in Food Preparation & Serving in Virginia is 4.8%.
What is the Percentage of Population Employed in Food Preparation & Serving in the United States?
Percentage of Population Employed in Food Preparation & Serving in the United States is 5.3%.