Zip Codes with the Highest Percentage of Population Employed in Community & Social Service in Falls Church, VA
RELATED REPORTS & OPTIONS
Community & Social Service
Falls Church
Compare Zip Codes
Map of Zip Codes with the Highest Percentage of Population Employed in Community & Social Service in Falls Church
11.0%
16.2%
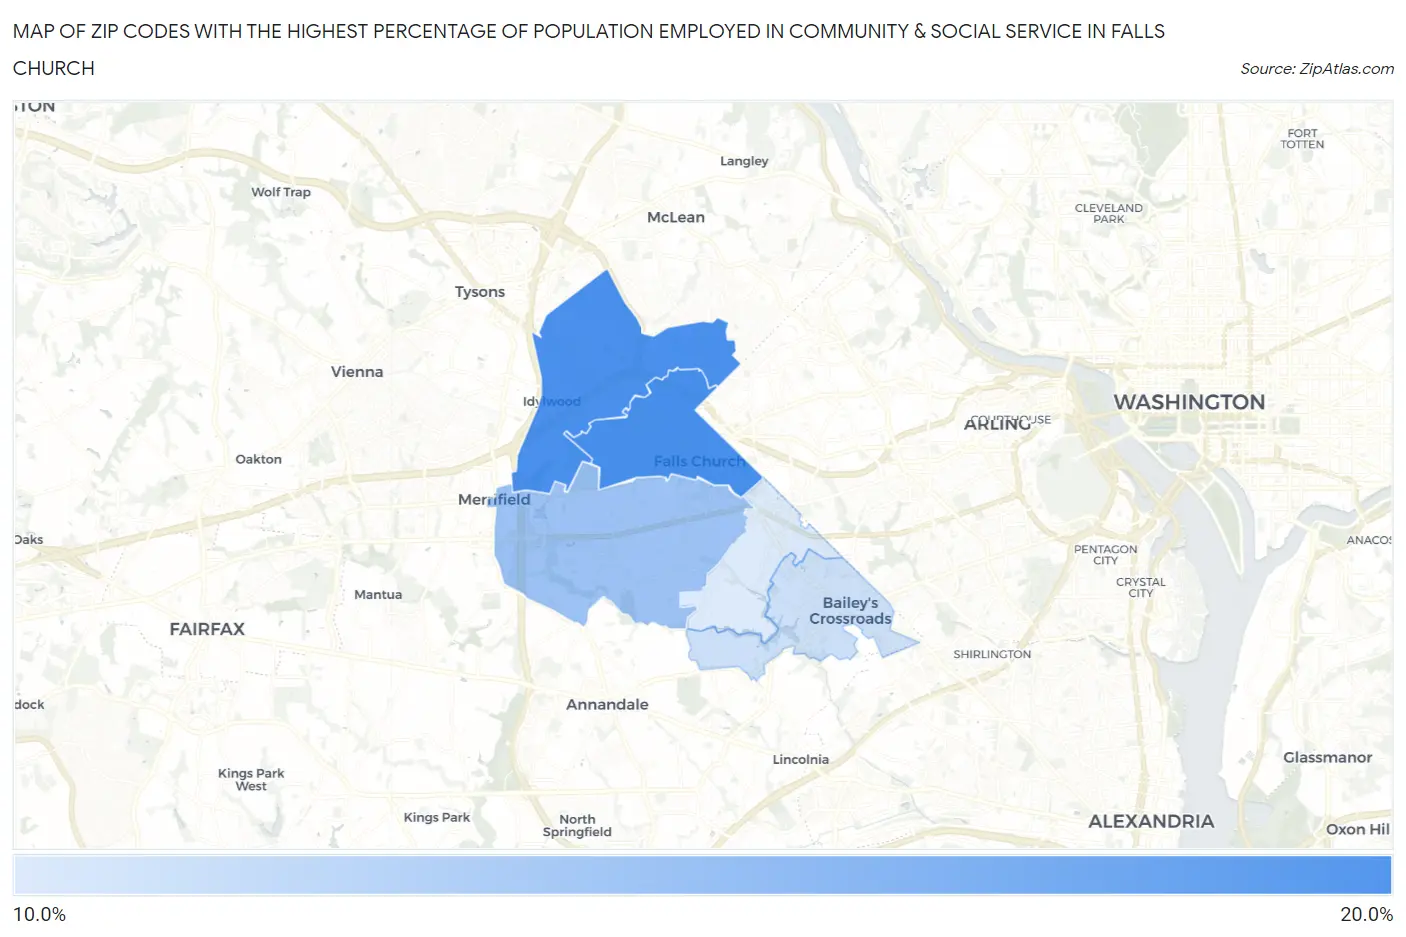
Zip Codes with the Highest Percentage of Population Employed in Community & Social Service in Falls Church, VA
| Zip Code | % Employed | vs State | vs National | |
| 1. | 22046 | 16.2% | 12.1%(+4.08)#133 | 11.2%(+5.00)#3,903 |
| 2. | 22043 | 16.1% | 12.1%(+3.97)#137 | 11.2%(+4.89)#3,995 |
| 3. | 22042 | 13.3% | 12.1%(+1.17)#231 | 11.2%(+2.10)#7,059 |
| 4. | 22041 | 11.6% | 12.1%(-0.577)#310 | 11.2%(+0.344)#10,330 |
| 5. | 22044 | 11.0% | 12.1%(-1.09)#348 | 11.2%(-0.168)#11,518 |
1
Common Questions
What are the Top 3 Zip Codes with the Highest Percentage of Population Employed in Community & Social Service in Falls Church, VA?
Top 3 Zip Codes with the Highest Percentage of Population Employed in Community & Social Service in Falls Church, VA are:
What zip code has the Highest Percentage of Population Employed in Community & Social Service in Falls Church, VA?
22046 has the Highest Percentage of Population Employed in Community & Social Service in Falls Church, VA with 16.2%.
What is the Percentage of Population Employed in Community & Social Service in Falls Church, VA?
Percentage of Population Employed in Community & Social Service in Falls Church is 16.9%.
What is the Percentage of Population Employed in Community & Social Service in Virginia?
Percentage of Population Employed in Community & Social Service in Virginia is 12.1%.
What is the Percentage of Population Employed in Community & Social Service in the United States?
Percentage of Population Employed in Community & Social Service in the United States is 11.2%.