Zip Codes with the Highest Percentage of Population with a Degree in Liberal Arts and History in Falls Church, VA
RELATED REPORTS & OPTIONS
Liberal Arts and History
Falls Church
Compare Zip Codes
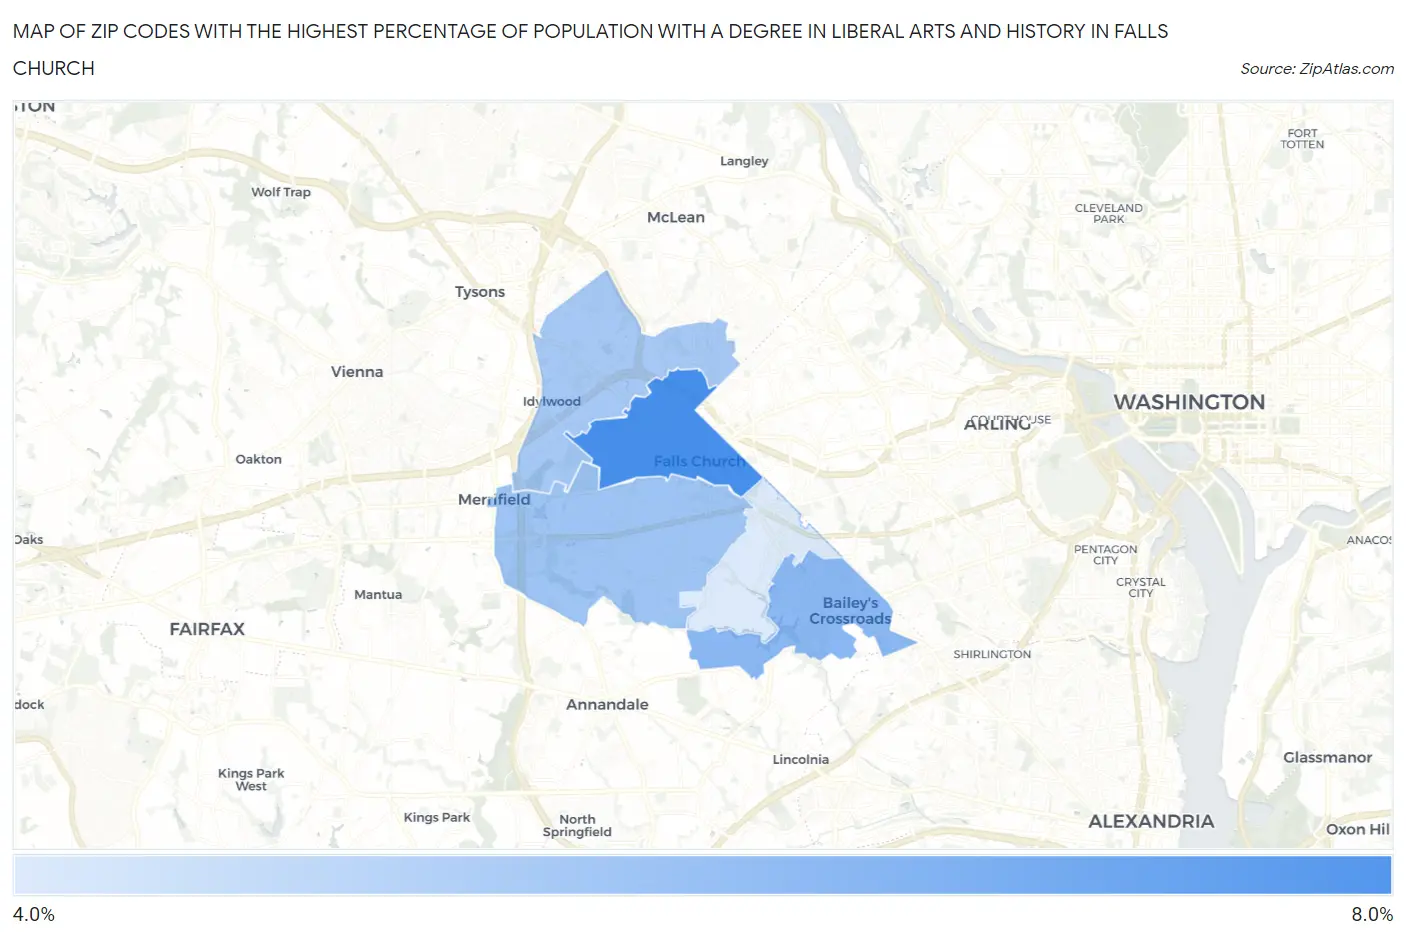
Map of Zip Codes with the Highest Percentage of Population with a Degree in Liberal Arts and History in Falls Church
4.1%
7.7%
Zip Codes with the Highest Percentage of Population with a Degree in Liberal Arts and History in Falls Church, VA
| Zip Code | % Graduates | vs State | vs National | |
| 1. | 22046 | 7.7% | 5.9%(+1.87)#226 | 4.9%(+2.85)#5,261 |
| 2. | 22041 | 6.1% | 5.9%(+0.233)#328 | 4.9%(+1.22)#8,291 |
| 3. | 22042 | 5.6% | 5.9%(-0.246)#365 | 4.9%(+0.737)#9,549 |
| 4. | 22043 | 5.4% | 5.9%(-0.451)#378 | 4.9%(+0.532)#10,124 |
| 5. | 22044 | 4.1% | 5.9%(-1.75)#491 | 4.9%(-0.765)#14,376 |
1
Common Questions
What are the Top 3 Zip Codes with the Highest Percentage of Population with a Degree in Liberal Arts and History in Falls Church, VA?
Top 3 Zip Codes with the Highest Percentage of Population with a Degree in Liberal Arts and History in Falls Church, VA are:
What zip code has the Highest Percentage of Population with a Degree in Liberal Arts and History in Falls Church, VA?
22046 has the Highest Percentage of Population with a Degree in Liberal Arts and History in Falls Church, VA with 7.7%.
What is the Percentage of Population with a Degree in Liberal Arts and History in Falls Church, VA?
Percentage of Population with a Degree in Liberal Arts and History in Falls Church is 8.2%.
What is the Percentage of Population with a Degree in Liberal Arts and History in Virginia?
Percentage of Population with a Degree in Liberal Arts and History in Virginia is 5.9%.
What is the Percentage of Population with a Degree in Liberal Arts and History in the United States?
Percentage of Population with a Degree in Liberal Arts and History in the United States is 4.9%.