Black/African American vs Immigrants from Honduras Female Unemployment
COMPARE
Black/African American
Immigrants from Honduras
Female Unemployment
Female Unemployment Comparison
Blacks/African Americans
Immigrants from Honduras
6.5%
FEMALE UNEMPLOYMENT
0.0/ 100
METRIC RATING
321st/ 347
METRIC RANK
5.9%
FEMALE UNEMPLOYMENT
0.0/ 100
METRIC RATING
270th/ 347
METRIC RANK
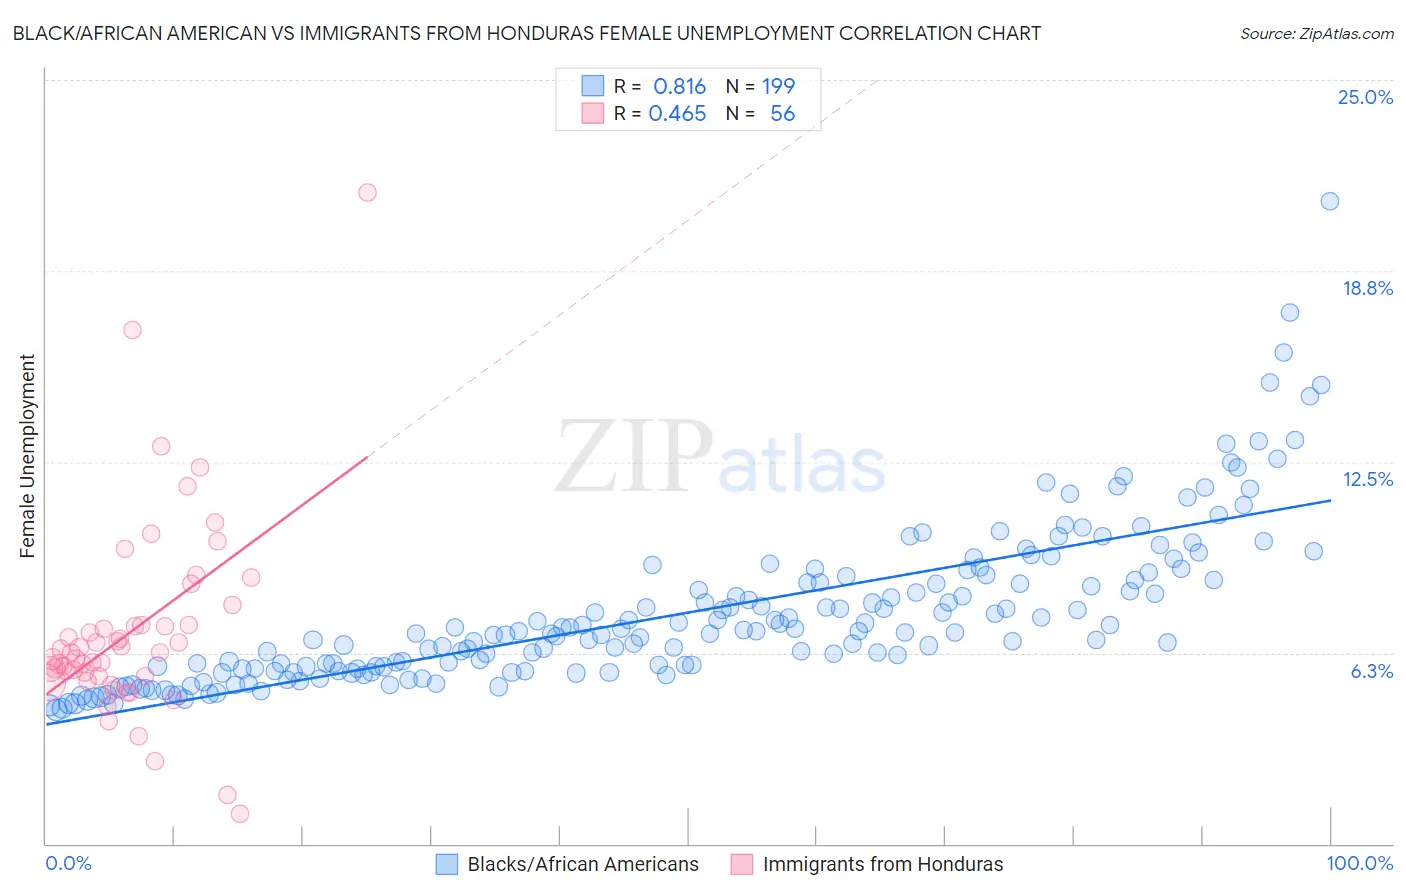
Black/African American vs Immigrants from Honduras Female Unemployment Correlation Chart
The statistical analysis conducted on geographies consisting of 554,894,161 people shows a very strong positive correlation between the proportion of Blacks/African Americans and unemploymnet rate among females in the United States with a correlation coefficient (R) of 0.816 and weighted average of 6.5%. Similarly, the statistical analysis conducted on geographies consisting of 321,601,293 people shows a moderate positive correlation between the proportion of Immigrants from Honduras and unemploymnet rate among females in the United States with a correlation coefficient (R) of 0.465 and weighted average of 5.9%, a difference of 9.5%.
Female Unemployment Correlation Summary
| Measurement | Black/African American | Immigrants from Honduras |
| Minimum | 4.4% | 1.0% |
| Maximum | 21.0% | 21.3% |
| Range | 16.6% | 20.3% |
| Mean | 7.6% | 7.0% |
| Median | 6.9% | 6.3% |
| Interquartile 25% (IQ1) | 5.7% | 5.5% |
| Interquartile 75% (IQ3) | 8.6% | 7.1% |
| Interquartile Range (IQR) | 2.9% | 1.6% |
| Standard Deviation (Sample) | 2.6% | 3.3% |
| Standard Deviation (Population) | 2.6% | 3.3% |
Similar Demographics by Female Unemployment
Demographics Similar to Blacks/African Americans by Female Unemployment
In terms of female unemployment, the demographic groups most similar to Blacks/African Americans are Vietnamese (6.5%, a difference of 0.080%), Immigrants from Belize (6.5%, a difference of 0.18%), Immigrants from Dominica (6.5%, a difference of 0.54%), Immigrants from Bangladesh (6.5%, a difference of 0.55%), and British West Indian (6.4%, a difference of 0.74%).
| Demographics | Rating | Rank | Female Unemployment |
| Immigrants | Ecuador | 0.0 /100 | #314 | Tragic 6.4% |
| Pueblo | 0.0 /100 | #315 | Tragic 6.4% |
| Houma | 0.0 /100 | #316 | Tragic 6.4% |
| Immigrants | St. Vincent and the Grenadines | 0.0 /100 | #317 | Tragic 6.4% |
| British West Indians | 0.0 /100 | #318 | Tragic 6.4% |
| Immigrants | Bangladesh | 0.0 /100 | #319 | Tragic 6.5% |
| Immigrants | Dominica | 0.0 /100 | #320 | Tragic 6.5% |
| Blacks/African Americans | 0.0 /100 | #321 | Tragic 6.5% |
| Vietnamese | 0.0 /100 | #322 | Tragic 6.5% |
| Immigrants | Belize | 0.0 /100 | #323 | Tragic 6.5% |
| Cheyenne | 0.0 /100 | #324 | Tragic 6.6% |
| Apache | 0.0 /100 | #325 | Tragic 6.6% |
| Natives/Alaskans | 0.0 /100 | #326 | Tragic 6.6% |
| Alaska Natives | 0.0 /100 | #327 | Tragic 6.6% |
| Guyanese | 0.0 /100 | #328 | Tragic 6.7% |
Demographics Similar to Immigrants from Honduras by Female Unemployment
In terms of female unemployment, the demographic groups most similar to Immigrants from Honduras are Central American (5.9%, a difference of 0.10%), Lumbee (5.9%, a difference of 0.29%), Ghanaian (5.9%, a difference of 0.30%), African (5.9%, a difference of 0.38%), and Immigrants from Western Africa (5.9%, a difference of 0.41%).
| Demographics | Rating | Rank | Female Unemployment |
| Immigrants | Azores | 0.1 /100 | #263 | Tragic 5.8% |
| Immigrants | Bahamas | 0.1 /100 | #264 | Tragic 5.8% |
| Blackfeet | 0.0 /100 | #265 | Tragic 5.9% |
| Cape Verdeans | 0.0 /100 | #266 | Tragic 5.9% |
| Nepalese | 0.0 /100 | #267 | Tragic 5.9% |
| Hondurans | 0.0 /100 | #268 | Tragic 5.9% |
| Immigrants | Western Africa | 0.0 /100 | #269 | Tragic 5.9% |
| Immigrants | Honduras | 0.0 /100 | #270 | Tragic 5.9% |
| Central Americans | 0.0 /100 | #271 | Tragic 5.9% |
| Lumbee | 0.0 /100 | #272 | Tragic 5.9% |
| Ghanaians | 0.0 /100 | #273 | Tragic 5.9% |
| Africans | 0.0 /100 | #274 | Tragic 5.9% |
| Senegalese | 0.0 /100 | #275 | Tragic 6.0% |
| Bahamians | 0.0 /100 | #276 | Tragic 6.0% |
| Immigrants | Ghana | 0.0 /100 | #277 | Tragic 6.0% |