Black/African American Single Mother Poverty
COMPARE
Black/African American
Select to Compare
Single Mother Poverty
Black/African American Single Mother Poverty
35.2%
POVERTY | SINGLE MOTHERS
0.0/ 100
METRIC RATING
322nd/ 347
METRIC RANK
Black/African American Single Mother Poverty Correlation Chart
The statistical analysis conducted on geographies consisting of 541,579,434 people shows a significant positive correlation between the proportion of Blacks/African Americans and poverty level among single mothers in the United States with a correlation coefficient (R) of 0.603 and weighted average of 35.2%. On average, for every 1% (one percent) increase in Blacks/African Americans within a typical geography, there is an increase of 0.13% in poverty level among single mothers.
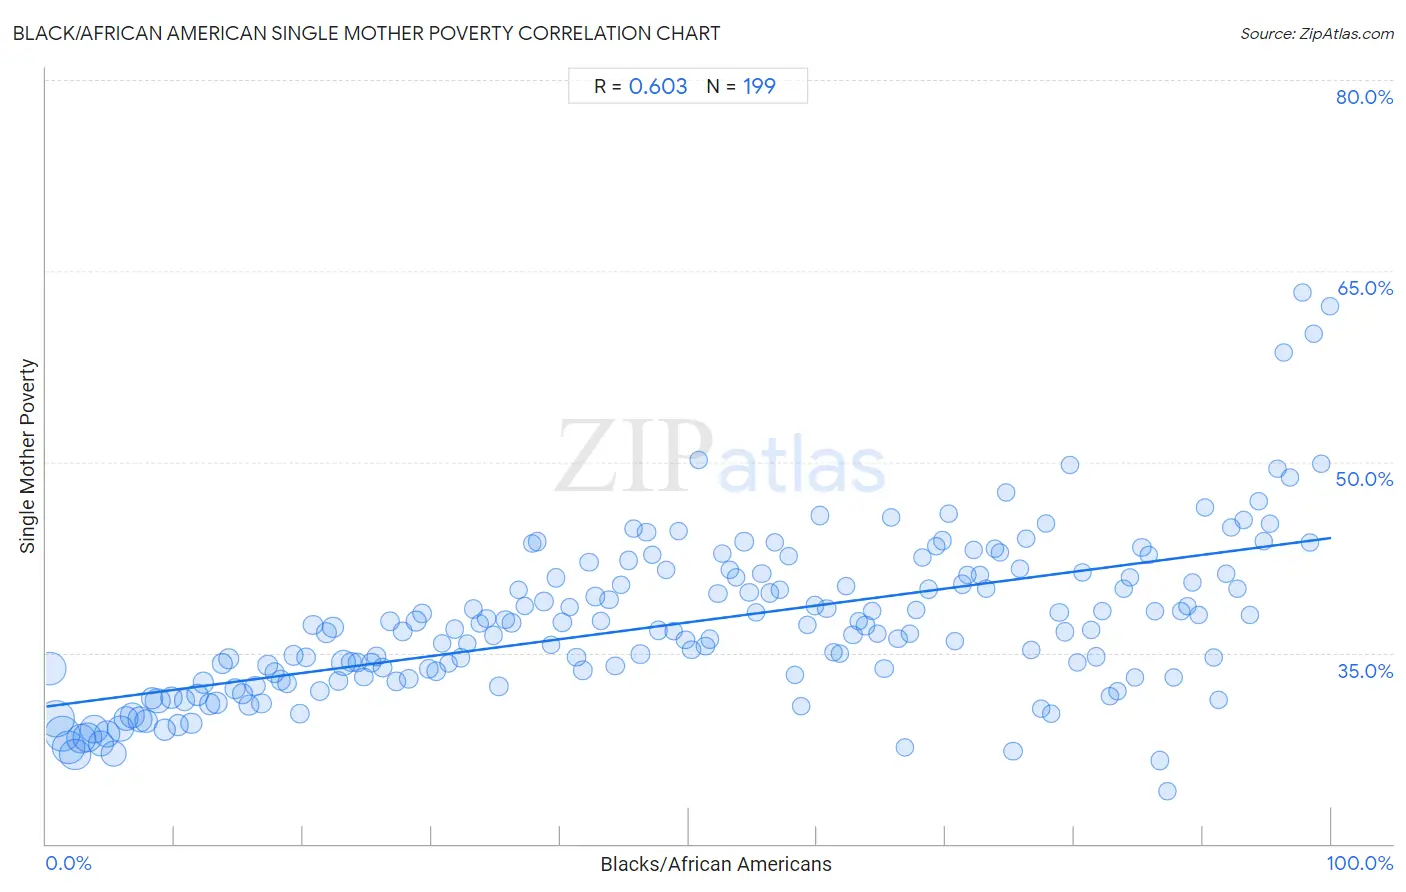
It is essential to understand that the correlation between the percentage of Blacks/African Americans and poverty level among single mothers does not imply a direct cause-and-effect relationship. It remains uncertain whether the presence of Blacks/African Americans influences an upward or downward trend in the level of poverty level among single mothers within an area, or if Blacks/African Americans simply ended up residing in those areas with higher or lower levels of poverty level among single mothers due to other factors.
Demographics Similar to Blacks/African Americans by Single Mother Poverty
In terms of single mother poverty, the demographic groups most similar to Blacks/African Americans are Paiute (35.1%, a difference of 0.20%), Kiowa (35.5%, a difference of 0.71%), Ottawa (35.5%, a difference of 0.92%), Iroquois (34.8%, a difference of 1.1%), and Chippewa (34.8%, a difference of 1.3%).
| Demographics | Rating | Rank | Single Mother Poverty |
| Hopi | 0.0 /100 | #315 | Tragic 34.5% |
| Dominicans | 0.0 /100 | #316 | Tragic 34.5% |
| Cherokee | 0.0 /100 | #317 | Tragic 34.5% |
| Immigrants from Honduras | 0.0 /100 | #318 | Tragic 34.7% |
| Chippewa | 0.0 /100 | #319 | Tragic 34.8% |
| Iroquois | 0.0 /100 | #320 | Tragic 34.8% |
| Paiute | 0.0 /100 | #321 | Tragic 35.1% |
| Blacks/African Americans | 0.0 /100 | #322 | Tragic 35.2% |
| Kiowa | 0.0 /100 | #323 | Tragic 35.5% |
| Ottawa | 0.0 /100 | #324 | Tragic 35.5% |
| Ute | 0.0 /100 | #325 | Tragic 35.7% |
| Seminole | 0.0 /100 | #326 | Tragic 35.8% |
| Yakama | 0.0 /100 | #327 | Tragic 36.4% |
| Choctaw | 0.0 /100 | #328 | Tragic 36.4% |
| Apache | 0.0 /100 | #329 | Tragic 36.6% |
Black/African American Single Mother Poverty Correlation Summary
| Measurement | Black/African American Data | Single Mother Poverty Data |
| Minimum | 0.27% | 24.1% |
| Maximum | 99.9% | 63.3% |
| Range | 99.7% | 39.2% |
| Mean | 49.8% | 37.4% |
| Median | 49.7% | 36.8% |
| Interquartile 25% (IQ1) | 24.7% | 33.1% |
| Interquartile 75% (IQ3) | 74.7% | 41.1% |
| Interquartile Range (IQR) | 49.9% | 8.0% |
| Standard Deviation (Sample) | 28.8% | 6.3% |
| Standard Deviation (Population) | 28.7% | 6.3% |
Correlation Details
| Black/African American Percentile | Sample Size | Single Mother Poverty |
[ 0.0% - 0.5% ] 0.27% | 26,355,657 | 33.8% |
[ 0.5% - 1.0% ] 0.74% | 32,080,481 | 29.8% |
[ 1.0% - 1.5% ] 1.23% | 30,047,643 | 28.7% |
[ 1.5% - 2.0% ] 1.74% | 26,157,016 | 27.6% |
[ 2.0% - 2.5% ] 2.24% | 23,172,069 | 27.0% |
[ 2.5% - 3.0% ] 2.76% | 19,556,072 | 28.3% |
[ 3.0% - 3.5% ] 3.24% | 19,564,214 | 28.3% |
[ 3.5% - 4.0% ] 3.74% | 15,891,542 | 29.0% |
[ 4.0% - 4.5% ] 4.24% | 13,946,324 | 27.9% |
[ 4.5% - 5.0% ] 4.74% | 14,264,839 | 28.7% |
[ 5.0% - 5.5% ] 5.24% | 13,099,309 | 27.0% |
[ 5.5% - 6.0% ] 5.76% | 13,426,764 | 29.1% |
[ 6.0% - 6.5% ] 6.23% | 11,406,654 | 29.8% |
[ 6.5% - 7.0% ] 6.72% | 11,396,253 | 30.1% |
[ 7.0% - 7.5% ] 7.26% | 10,742,016 | 29.8% |
[ 7.5% - 8.0% ] 7.75% | 8,863,026 | 29.7% |
[ 8.0% - 8.5% ] 8.24% | 7,982,383 | 31.4% |
[ 8.5% - 9.0% ] 8.69% | 12,168,251 | 31.2% |
[ 9.0% - 9.5% ] 9.24% | 7,414,963 | 29.0% |
[ 9.5% - 10.0% ] 9.75% | 5,666,986 | 31.5% |
[ 10.0% - 10.5% ] 10.27% | 6,186,387 | 29.3% |
[ 10.5% - 11.0% ] 10.76% | 5,917,137 | 31.3% |
[ 11.0% - 11.5% ] 11.27% | 5,826,704 | 29.5% |
[ 11.5% - 12.0% ] 11.75% | 6,548,916 | 31.7% |
[ 12.0% - 12.5% ] 12.24% | 5,666,200 | 32.7% |
[ 12.5% - 13.0% ] 12.73% | 5,149,266 | 31.0% |
[ 13.0% - 13.5% ] 13.26% | 5,506,927 | 31.1% |
[ 13.5% - 14.0% ] 13.72% | 4,920,832 | 34.1% |
[ 14.0% - 14.5% ] 14.22% | 4,262,404 | 34.5% |
[ 14.5% - 15.0% ] 14.73% | 4,127,742 | 32.2% |
[ 15.0% - 15.5% ] 15.25% | 4,326,007 | 31.8% |
[ 15.5% - 16.0% ] 15.75% | 3,562,577 | 30.9% |
[ 16.0% - 16.5% ] 16.25% | 3,207,326 | 32.4% |
[ 16.5% - 17.0% ] 16.75% | 3,337,473 | 31.0% |
[ 17.0% - 17.5% ] 17.22% | 3,458,750 | 34.0% |
[ 17.5% - 18.0% ] 17.77% | 3,629,309 | 33.4% |
[ 18.0% - 18.5% ] 18.26% | 3,531,844 | 32.9% |
[ 18.5% - 19.0% ] 18.73% | 3,640,220 | 32.6% |
[ 19.0% - 19.5% ] 19.23% | 3,010,858 | 34.8% |
[ 19.5% - 20.0% ] 19.75% | 2,500,473 | 30.2% |
[ 20.0% - 20.5% ] 20.23% | 2,739,641 | 34.7% |
[ 20.5% - 21.0% ] 20.76% | 2,308,587 | 37.2% |
[ 21.0% - 21.5% ] 21.29% | 2,707,965 | 32.0% |
[ 21.5% - 22.0% ] 21.77% | 3,727,047 | 36.6% |
[ 22.0% - 22.5% ] 22.31% | 4,845,704 | 37.0% |
[ 22.5% - 23.0% ] 22.72% | 3,010,442 | 32.8% |
[ 23.0% - 23.5% ] 23.15% | 11,588,908 | 34.2% |
[ 23.5% - 24.0% ] 23.75% | 3,948,686 | 34.3% |
[ 24.0% - 24.5% ] 24.22% | 2,117,514 | 34.2% |
[ 24.5% - 25.0% ] 24.74% | 1,962,246 | 33.1% |
[ 25.0% - 25.5% ] 25.28% | 1,553,703 | 34.2% |
[ 25.5% - 26.0% ] 25.71% | 1,454,431 | 34.7% |
[ 26.0% - 26.5% ] 26.22% | 1,884,045 | 33.8% |
[ 26.5% - 27.0% ] 26.77% | 2,120,682 | 37.5% |
[ 27.0% - 27.5% ] 27.23% | 1,773,199 | 32.7% |
[ 27.5% - 28.0% ] 27.75% | 1,470,635 | 36.7% |
[ 28.0% - 28.5% ] 28.22% | 1,943,599 | 32.9% |
[ 28.5% - 29.0% ] 28.80% | 4,732,595 | 37.5% |
[ 29.0% - 29.5% ] 29.24% | 3,212,019 | 38.1% |
[ 29.5% - 30.0% ] 29.77% | 1,859,930 | 33.8% |
[ 30.0% - 30.5% ] 30.35% | 2,232,100 | 33.6% |
[ 30.5% - 31.0% ] 30.81% | 1,188,302 | 35.7% |
[ 31.0% - 31.5% ] 31.30% | 945,096 | 34.1% |
[ 31.5% - 32.0% ] 31.79% | 1,016,337 | 36.9% |
[ 32.0% - 32.5% ] 32.27% | 1,260,954 | 34.6% |
[ 32.5% - 33.0% ] 32.74% | 725,749 | 35.7% |
[ 33.0% - 33.5% ] 33.25% | 1,247,564 | 38.4% |
[ 33.5% - 34.0% ] 33.75% | 900,074 | 37.3% |
[ 34.0% - 34.5% ] 34.28% | 829,442 | 37.7% |
[ 34.5% - 35.0% ] 34.79% | 909,021 | 36.4% |
[ 35.0% - 35.5% ] 35.24% | 1,726,829 | 32.4% |
[ 35.5% - 36.0% ] 35.74% | 1,279,073 | 37.6% |
[ 36.0% - 36.5% ] 36.23% | 1,183,890 | 37.4% |
[ 36.5% - 37.0% ] 36.75% | 552,900 | 40.0% |
[ 37.0% - 37.5% ] 37.25% | 907,077 | 38.7% |
[ 37.5% - 38.0% ] 37.80% | 823,645 | 43.6% |
[ 38.0% - 38.5% ] 38.19% | 952,769 | 43.7% |
[ 38.5% - 39.0% ] 38.70% | 1,449,137 | 39.1% |
[ 39.0% - 39.5% ] 39.31% | 519,832 | 35.6% |
[ 39.5% - 40.0% ] 39.68% | 906,964 | 40.9% |
[ 40.0% - 40.5% ] 40.16% | 2,705,801 | 37.4% |
[ 40.5% - 41.0% ] 40.73% | 1,178,991 | 38.6% |
[ 41.0% - 41.5% ] 41.26% | 1,023,104 | 34.6% |
[ 41.5% - 42.0% ] 41.76% | 953,757 | 33.6% |
[ 42.0% - 42.5% ] 42.25% | 875,700 | 42.1% |
[ 42.5% - 43.0% ] 42.73% | 1,015,815 | 39.4% |
[ 43.0% - 43.5% ] 43.19% | 1,010,809 | 37.5% |
[ 43.5% - 44.0% ] 43.82% | 994,393 | 39.2% |
[ 44.0% - 44.5% ] 44.29% | 1,185,163 | 34.0% |
[ 44.5% - 45.0% ] 44.74% | 669,649 | 40.3% |
[ 45.0% - 45.5% ] 45.34% | 680,120 | 42.3% |
[ 45.5% - 46.0% ] 45.74% | 598,240 | 44.8% |
[ 46.0% - 46.5% ] 46.24% | 743,245 | 34.9% |
[ 46.5% - 47.0% ] 46.72% | 1,067,396 | 44.5% |
[ 47.0% - 47.5% ] 47.16% | 748,865 | 42.7% |
[ 47.5% - 48.0% ] 47.64% | 1,061,278 | 36.8% |
[ 48.0% - 48.5% ] 48.26% | 298,501 | 41.5% |
[ 48.5% - 49.0% ] 48.84% | 486,990 | 36.7% |
[ 49.0% - 49.5% ] 49.22% | 471,651 | 44.5% |
[ 49.5% - 50.0% ] 49.74% | 549,287 | 36.0% |
[ 50.0% - 50.5% ] 50.24% | 939,406 | 35.2% |
[ 50.5% - 51.0% ] 50.77% | 201,529 | 50.1% |
[ 51.0% - 51.5% ] 51.29% | 573,825 | 35.6% |
[ 51.5% - 52.0% ] 51.63% | 660,304 | 36.1% |
[ 52.0% - 52.5% ] 52.28% | 533,791 | 39.6% |
[ 52.5% - 53.0% ] 52.63% | 675,996 | 42.8% |
[ 53.0% - 53.5% ] 53.21% | 682,136 | 41.5% |
[ 53.5% - 54.0% ] 53.72% | 385,257 | 40.9% |
[ 54.0% - 54.5% ] 54.32% | 688,266 | 43.7% |
[ 54.5% - 55.0% ] 54.71% | 356,059 | 39.8% |
[ 55.0% - 55.5% ] 55.28% | 447,768 | 38.2% |
[ 55.5% - 56.0% ] 55.68% | 462,357 | 41.2% |
[ 56.0% - 56.5% ] 56.31% | 564,725 | 39.7% |
[ 56.5% - 57.0% ] 56.67% | 514,262 | 43.7% |
[ 57.0% - 57.5% ] 57.10% | 677,518 | 40.0% |
[ 57.5% - 58.0% ] 57.78% | 304,126 | 42.6% |
[ 58.0% - 58.5% ] 58.25% | 368,374 | 33.3% |
[ 58.5% - 59.0% ] 58.76% | 284,704 | 30.8% |
[ 59.0% - 59.5% ] 59.21% | 335,728 | 37.2% |
[ 59.5% - 60.0% ] 59.79% | 361,132 | 38.7% |
[ 60.0% - 60.5% ] 60.22% | 272,065 | 45.8% |
[ 60.5% - 61.0% ] 60.74% | 453,846 | 38.5% |
[ 61.0% - 61.5% ] 61.26% | 880,181 | 35.0% |
[ 61.5% - 62.0% ] 61.73% | 422,929 | 34.9% |
[ 62.0% - 62.5% ] 62.27% | 434,878 | 40.2% |
[ 62.5% - 63.0% ] 62.78% | 514,809 | 36.4% |
[ 63.0% - 63.5% ] 63.24% | 297,996 | 37.5% |
[ 63.5% - 64.0% ] 63.75% | 417,401 | 37.1% |
[ 64.0% - 64.5% ] 64.30% | 1,041,551 | 38.3% |
[ 64.5% - 65.0% ] 64.71% | 329,560 | 36.5% |
[ 65.0% - 65.5% ] 65.21% | 541,637 | 33.8% |
[ 65.5% - 66.0% ] 65.77% | 268,155 | 45.7% |
[ 66.0% - 66.5% ] 66.29% | 268,377 | 36.1% |
[ 66.5% - 67.0% ] 66.83% | 339,950 | 27.6% |
[ 67.0% - 67.5% ] 67.20% | 240,253 | 36.5% |
[ 67.5% - 68.0% ] 67.68% | 191,722 | 38.3% |
[ 68.0% - 68.5% ] 68.16% | 156,671 | 42.5% |
[ 68.5% - 69.0% ] 68.63% | 493,664 | 40.0% |
[ 69.0% - 69.5% ] 69.27% | 201,837 | 43.4% |
[ 69.5% - 70.0% ] 69.77% | 131,898 | 43.8% |
[ 70.0% - 70.5% ] 70.26% | 275,652 | 45.9% |
[ 70.5% - 71.0% ] 70.70% | 374,314 | 35.9% |
[ 71.0% - 71.5% ] 71.27% | 303,846 | 40.4% |
[ 71.5% - 72.0% ] 71.71% | 222,388 | 41.1% |
[ 72.0% - 72.5% ] 72.20% | 236,848 | 43.0% |
[ 72.5% - 73.0% ] 72.65% | 182,815 | 41.1% |
[ 73.0% - 73.5% ] 73.16% | 265,102 | 40.0% |
[ 73.5% - 74.0% ] 73.79% | 344,766 | 43.1% |
[ 74.0% - 74.5% ] 74.25% | 250,538 | 42.9% |
[ 74.5% - 75.0% ] 74.67% | 279,192 | 47.6% |
[ 75.0% - 75.5% ] 75.24% | 179,078 | 27.3% |
[ 75.5% - 76.0% ] 75.77% | 246,949 | 41.7% |
[ 76.0% - 76.5% ] 76.30% | 238,142 | 43.9% |
[ 76.5% - 77.0% ] 76.66% | 114,406 | 35.3% |
[ 77.0% - 77.5% ] 77.39% | 227,485 | 30.6% |
[ 77.5% - 78.0% ] 77.78% | 829,659 | 45.2% |
[ 78.0% - 78.5% ] 78.22% | 228,671 | 30.2% |
[ 78.5% - 79.0% ] 78.84% | 262,085 | 38.2% |
[ 79.0% - 79.5% ] 79.27% | 272,311 | 36.7% |
[ 79.5% - 80.0% ] 79.70% | 126,248 | 49.8% |
[ 80.0% - 80.5% ] 80.21% | 286,601 | 34.3% |
[ 80.5% - 81.0% ] 80.65% | 229,792 | 41.3% |
[ 81.0% - 81.5% ] 81.29% | 240,301 | 36.8% |
[ 81.5% - 82.0% ] 81.68% | 299,672 | 34.7% |
[ 82.0% - 82.5% ] 82.19% | 443,151 | 38.2% |
[ 82.5% - 83.0% ] 82.74% | 147,828 | 31.6% |
[ 83.0% - 83.5% ] 83.34% | 85,884 | 32.0% |
[ 83.5% - 84.0% ] 83.88% | 63,869 | 40.0% |
[ 84.0% - 84.5% ] 84.33% | 187,263 | 40.9% |
[ 84.5% - 85.0% ] 84.74% | 164,744 | 33.1% |
[ 85.0% - 85.5% ] 85.26% | 140,075 | 43.3% |
[ 85.5% - 86.0% ] 85.78% | 143,857 | 42.7% |
[ 86.0% - 86.5% ] 86.32% | 114,488 | 38.3% |
[ 86.5% - 87.0% ] 86.65% | 270,478 | 26.5% |
[ 87.0% - 87.5% ] 87.28% | 161,299 | 24.1% |
[ 87.5% - 88.0% ] 87.74% | 209,481 | 33.1% |
[ 88.0% - 88.5% ] 88.28% | 149,720 | 38.3% |
[ 88.5% - 89.0% ] 88.77% | 203,876 | 38.7% |
[ 89.0% - 89.5% ] 89.17% | 151,540 | 40.5% |
[ 89.5% - 90.0% ] 89.70% | 226,262 | 38.0% |
[ 90.0% - 90.5% ] 90.19% | 88,550 | 46.4% |
[ 90.5% - 91.0% ] 90.87% | 102,463 | 34.7% |
[ 91.0% - 91.5% ] 91.23% | 371,064 | 31.3% |
[ 91.5% - 92.0% ] 91.80% | 140,686 | 41.2% |
[ 92.0% - 92.5% ] 92.26% | 98,217 | 44.9% |
[ 92.5% - 93.0% ] 92.70% | 159,984 | 40.0% |
[ 93.0% - 93.5% ] 93.22% | 188,401 | 45.5% |
[ 93.5% - 94.0% ] 93.70% | 269,377 | 38.0% |
[ 94.0% - 94.5% ] 94.37% | 118,711 | 46.9% |
[ 94.5% - 95.0% ] 94.72% | 106,151 | 43.8% |
[ 95.0% - 95.5% ] 95.23% | 86,945 | 45.1% |
[ 95.5% - 96.0% ] 95.80% | 80,686 | 49.4% |
[ 96.0% - 96.5% ] 96.26% | 45,435 | 58.6% |
[ 96.5% - 97.0% ] 96.82% | 15,107 | 48.8% |
[ 97.5% - 98.0% ] 97.78% | 2,930 | 63.3% |
[ 98.0% - 98.5% ] 98.33% | 8,430 | 43.7% |
[ 98.5% - 99.0% ] 98.62% | 15,762 | 60.0% |
[ 99.0% - 99.5% ] 99.22% | 14,089 | 49.9% |
[ 99.5% - 100.0% ] 99.94% | 12,225 | 62.3% |