Subsaharan African vs Immigrants from Nigeria Male Unemployment
COMPARE
Subsaharan African
Immigrants from Nigeria
Male Unemployment
Male Unemployment Comparison
Sub-Saharan Africans
Immigrants from Nigeria
6.0%
MALE UNEMPLOYMENT
0.0/ 100
METRIC RATING
270th/ 347
METRIC RANK
6.0%
MALE UNEMPLOYMENT
0.0/ 100
METRIC RATING
269th/ 347
METRIC RANK
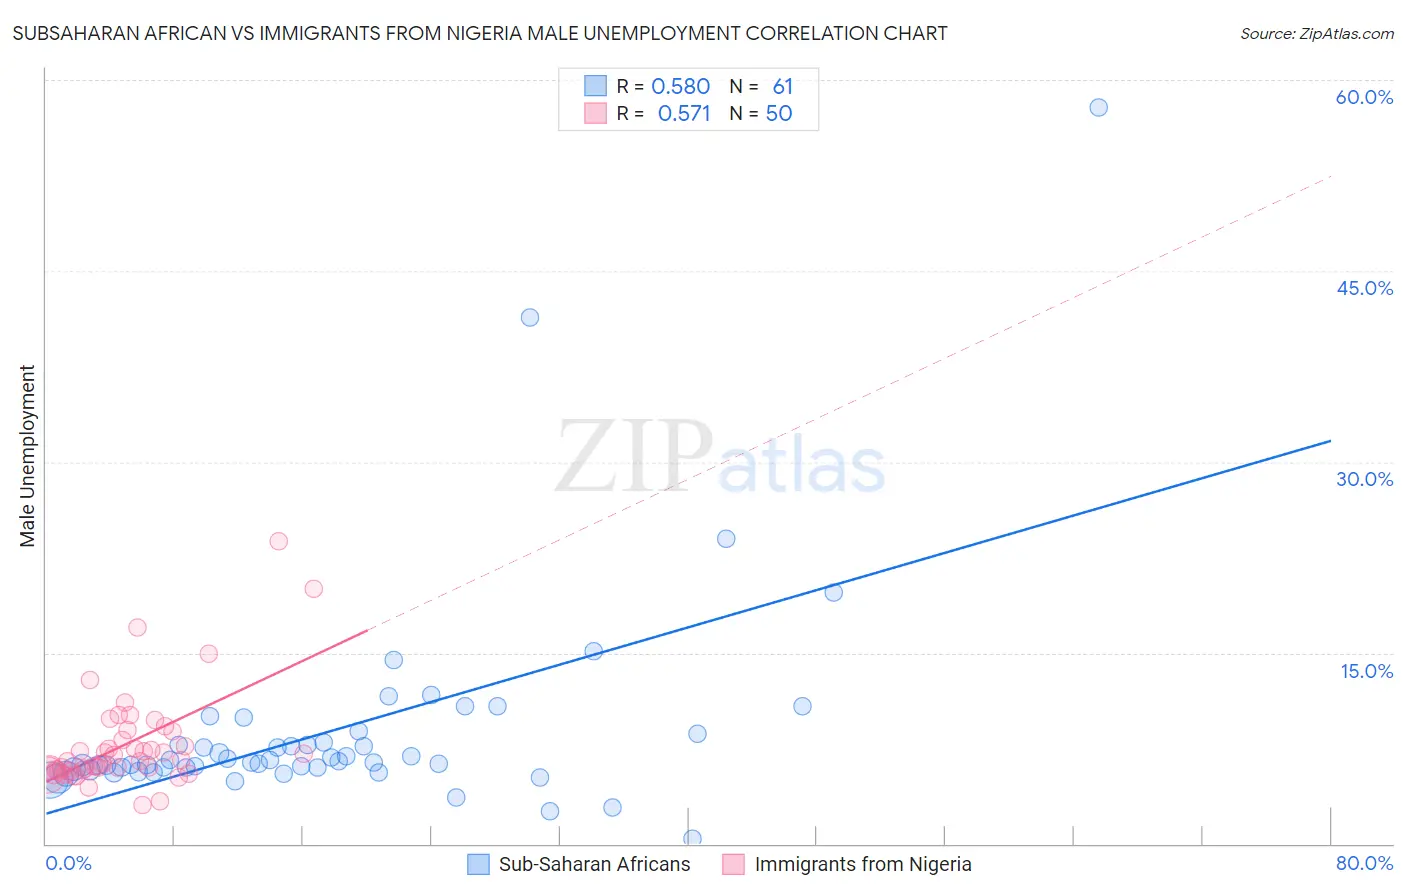
Subsaharan African vs Immigrants from Nigeria Male Unemployment Correlation Chart
The statistical analysis conducted on geographies consisting of 504,185,655 people shows a substantial positive correlation between the proportion of Sub-Saharan Africans and unemployment rate among males in the United States with a correlation coefficient (R) of 0.580 and weighted average of 6.0%. Similarly, the statistical analysis conducted on geographies consisting of 282,980,898 people shows a substantial positive correlation between the proportion of Immigrants from Nigeria and unemployment rate among males in the United States with a correlation coefficient (R) of 0.571 and weighted average of 6.0%, a difference of 0.13%.
Male Unemployment Correlation Summary
| Measurement | Subsaharan African | Immigrants from Nigeria |
| Minimum | 0.40% | 3.0% |
| Maximum | 57.8% | 23.8% |
| Range | 57.4% | 20.8% |
| Mean | 8.9% | 7.8% |
| Median | 6.4% | 6.6% |
| Interquartile 25% (IQ1) | 5.8% | 5.8% |
| Interquartile 75% (IQ3) | 8.3% | 8.8% |
| Interquartile Range (IQR) | 2.5% | 3.0% |
| Standard Deviation (Sample) | 8.5% | 3.9% |
| Standard Deviation (Population) | 8.5% | 3.9% |
Demographics Similar to Sub-Saharan Africans and Immigrants from Nigeria by Male Unemployment
In terms of male unemployment, the demographic groups most similar to Sub-Saharan Africans are Bermudan (5.9%, a difference of 0.40%), Blackfeet (6.0%, a difference of 0.50%), Nigerian (5.9%, a difference of 0.61%), Immigrants from Uzbekistan (6.0%, a difference of 0.73%), and Bahamian (5.9%, a difference of 0.74%). Similarly, the demographic groups most similar to Immigrants from Nigeria are Bermudan (5.9%, a difference of 0.27%), Nigerian (5.9%, a difference of 0.48%), Bahamian (5.9%, a difference of 0.60%), Blackfeet (6.0%, a difference of 0.64%), and French American Indian (5.9%, a difference of 0.74%).
| Demographics | Rating | Rank | Male Unemployment |
| Cajuns | 0.1 /100 | #259 | Tragic 5.8% |
| Immigrants | Central America | 0.1 /100 | #260 | Tragic 5.8% |
| Liberians | 0.1 /100 | #261 | Tragic 5.8% |
| Immigrants | Portugal | 0.1 /100 | #262 | Tragic 5.9% |
| Immigrants | Latin America | 0.1 /100 | #263 | Tragic 5.9% |
| Immigrants | Mexico | 0.0 /100 | #264 | Tragic 5.9% |
| French American Indians | 0.0 /100 | #265 | Tragic 5.9% |
| Bahamians | 0.0 /100 | #266 | Tragic 5.9% |
| Nigerians | 0.0 /100 | #267 | Tragic 5.9% |
| Bermudans | 0.0 /100 | #268 | Tragic 5.9% |
| Immigrants | Nigeria | 0.0 /100 | #269 | Tragic 6.0% |
| Sub-Saharan Africans | 0.0 /100 | #270 | Tragic 6.0% |
| Blackfeet | 0.0 /100 | #271 | Tragic 6.0% |
| Immigrants | Uzbekistan | 0.0 /100 | #272 | Tragic 6.0% |
| Armenians | 0.0 /100 | #273 | Tragic 6.0% |
| Immigrants | Sierra Leone | 0.0 /100 | #274 | Tragic 6.0% |
| Menominee | 0.0 /100 | #275 | Tragic 6.0% |
| Tlingit-Haida | 0.0 /100 | #276 | Tragic 6.0% |
| Immigrants | Liberia | 0.0 /100 | #277 | Tragic 6.1% |
| Immigrants | Fiji | 0.0 /100 | #278 | Tragic 6.1% |
| Ghanaians | 0.0 /100 | #279 | Tragic 6.1% |