Subsaharan African vs Immigrants from Zaire Male Unemployment
COMPARE
Subsaharan African
Immigrants from Zaire
Male Unemployment
Male Unemployment Comparison
Sub-Saharan Africans
Immigrants from Zaire
6.0%
MALE UNEMPLOYMENT
0.0/ 100
METRIC RATING
270th/ 347
METRIC RANK
5.4%
MALE UNEMPLOYMENT
13.7/ 100
METRIC RATING
200th/ 347
METRIC RANK
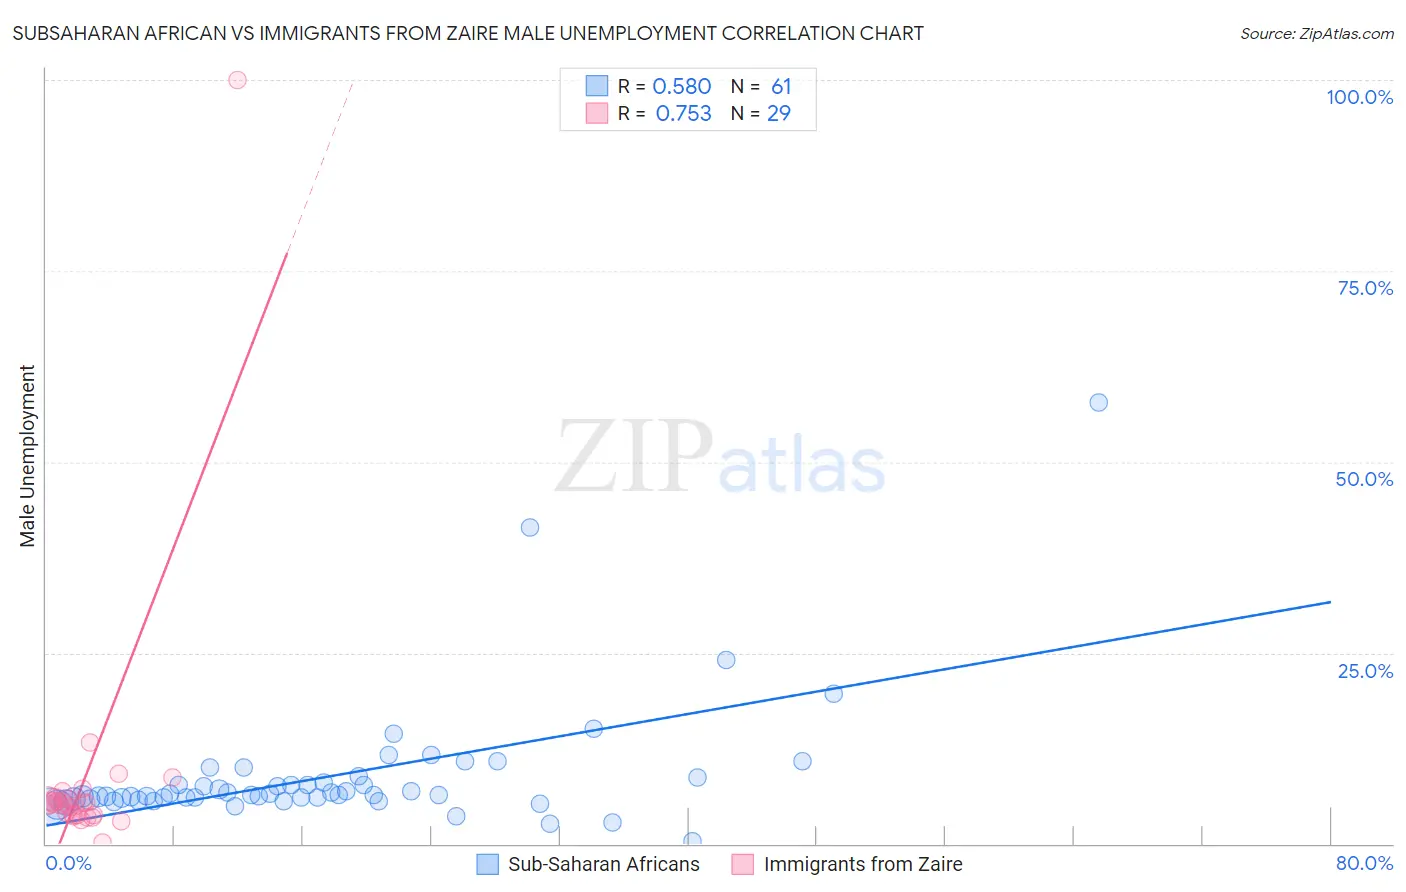
Subsaharan African vs Immigrants from Zaire Male Unemployment Correlation Chart
The statistical analysis conducted on geographies consisting of 504,185,655 people shows a substantial positive correlation between the proportion of Sub-Saharan Africans and unemployment rate among males in the United States with a correlation coefficient (R) of 0.580 and weighted average of 6.0%. Similarly, the statistical analysis conducted on geographies consisting of 107,173,070 people shows a strong positive correlation between the proportion of Immigrants from Zaire and unemployment rate among males in the United States with a correlation coefficient (R) of 0.753 and weighted average of 5.4%, a difference of 9.6%.
Male Unemployment Correlation Summary
| Measurement | Subsaharan African | Immigrants from Zaire |
| Minimum | 0.40% | 0.20% |
| Maximum | 57.8% | 100.0% |
| Range | 57.4% | 99.8% |
| Mean | 8.9% | 8.5% |
| Median | 6.4% | 5.3% |
| Interquartile 25% (IQ1) | 5.8% | 3.7% |
| Interquartile 75% (IQ3) | 8.3% | 6.0% |
| Interquartile Range (IQR) | 2.5% | 2.3% |
| Standard Deviation (Sample) | 8.5% | 17.7% |
| Standard Deviation (Population) | 8.5% | 17.4% |
Similar Demographics by Male Unemployment
Demographics Similar to Sub-Saharan Africans by Male Unemployment
In terms of male unemployment, the demographic groups most similar to Sub-Saharan Africans are Immigrants from Nigeria (6.0%, a difference of 0.13%), Bermudan (5.9%, a difference of 0.40%), Blackfeet (6.0%, a difference of 0.50%), Nigerian (5.9%, a difference of 0.61%), and Immigrants from Uzbekistan (6.0%, a difference of 0.73%).
| Demographics | Rating | Rank | Male Unemployment |
| Immigrants | Latin America | 0.1 /100 | #263 | Tragic 5.9% |
| Immigrants | Mexico | 0.0 /100 | #264 | Tragic 5.9% |
| French American Indians | 0.0 /100 | #265 | Tragic 5.9% |
| Bahamians | 0.0 /100 | #266 | Tragic 5.9% |
| Nigerians | 0.0 /100 | #267 | Tragic 5.9% |
| Bermudans | 0.0 /100 | #268 | Tragic 5.9% |
| Immigrants | Nigeria | 0.0 /100 | #269 | Tragic 6.0% |
| Sub-Saharan Africans | 0.0 /100 | #270 | Tragic 6.0% |
| Blackfeet | 0.0 /100 | #271 | Tragic 6.0% |
| Immigrants | Uzbekistan | 0.0 /100 | #272 | Tragic 6.0% |
| Armenians | 0.0 /100 | #273 | Tragic 6.0% |
| Immigrants | Sierra Leone | 0.0 /100 | #274 | Tragic 6.0% |
| Menominee | 0.0 /100 | #275 | Tragic 6.0% |
| Tlingit-Haida | 0.0 /100 | #276 | Tragic 6.0% |
| Immigrants | Liberia | 0.0 /100 | #277 | Tragic 6.1% |
Demographics Similar to Immigrants from Zaire by Male Unemployment
In terms of male unemployment, the demographic groups most similar to Immigrants from Zaire are Immigrants from Philippines (5.4%, a difference of 0.020%), Nonimmigrants (5.4%, a difference of 0.070%), Immigrants from Laos (5.4%, a difference of 0.080%), Immigrants from Greece (5.4%, a difference of 0.10%), and Immigrants from Thailand (5.4%, a difference of 0.12%).
| Demographics | Rating | Rank | Male Unemployment |
| Immigrants | Israel | 25.2 /100 | #193 | Fair 5.4% |
| Spanish | 19.7 /100 | #194 | Poor 5.4% |
| Immigrants | Southern Europe | 17.7 /100 | #195 | Poor 5.4% |
| Albanians | 17.3 /100 | #196 | Poor 5.4% |
| Alsatians | 16.7 /100 | #197 | Poor 5.4% |
| Immigrants | Thailand | 14.7 /100 | #198 | Poor 5.4% |
| Immigrants | Greece | 14.5 /100 | #199 | Poor 5.4% |
| Immigrants | Zaire | 13.7 /100 | #200 | Poor 5.4% |
| Immigrants | Philippines | 13.5 /100 | #201 | Poor 5.4% |
| Immigrants | Nonimmigrants | 13.1 /100 | #202 | Poor 5.4% |
| Immigrants | Laos | 13.0 /100 | #203 | Poor 5.4% |
| Guamanians/Chamorros | 12.3 /100 | #204 | Poor 5.4% |
| Immigrants | Costa Rica | 11.4 /100 | #205 | Poor 5.5% |
| Immigrants | Ukraine | 9.9 /100 | #206 | Tragic 5.5% |
| Immigrants | Syria | 9.3 /100 | #207 | Tragic 5.5% |