Subsaharan African vs Immigrants from Nigeria Disability

COMPARE

Subsaharan African
Race
Ancestry
AfghanAfricanAlaska NativeAlaskan AthabascanAlbanianAleutAlsatianAmericanApacheArabArapahoArgentineanArmenianAssyrian/Chaldean/SyriacAustralianAustrianBahamianBangladeshiBarbadianBasqueBelgianBelizeanBermudanBhutaneseBlackfeetBolivianBrazilianBritishBritish West IndianBulgarianBurmeseCajunCambodianCanadianCape VerdeanCarpatho RusynCelticCentral AmericanCentral American IndianCherokeeCheyenneChickasawChileanChineseChippewaChoctawColombianColvilleComancheCosta RicanCreeCreekCroatianCrowCubanCypriotCzechCzechoslovakianDanishDelawareDominicanDutchDutch West IndianEastern EuropeanEcuadorianEgyptianEnglishEstonianEthiopianEuropeanFijianFilipinoFinnishFrenchFrench American IndianFrench CanadianGermanGerman RussianGhanaianGreekGuamanian/ChamorroGuatemalanGuyaneseHaitianHmongHonduranHopiHoumaHungarianIcelanderIndian (Asian)IndonesianInupiatIranianIraqiIrishIroquoisIsraeliItalianJamaicanJapaneseJordanianKenyanKiowaKoreanLaotianLatvianLebaneseLiberianLithuanianLumbeeLuxembourgerMacedonianMalaysianMalteseMarshalleseMenomineeMexicanMexican American IndianMongolianMoroccanNative HawaiianNavajoNepaleseNew ZealanderNicaraguanNigerianNorthern EuropeanNorwegianOkinawanOsageOttawaPaiutePakistaniPalestinianPanamanianParaguayanPennsylvania GermanPeruvianPimaPolishPortuguesePotawatomiPuebloPuerto RicanPuget Sound SalishRomanianRussianSalvadoranSamoanScandinavianScotch-IrishScottishSeminoleSenegaleseSerbianShoshoneSierra LeoneanSiouxSlavicSlovakSloveneSomaliSouth AfricanSouth AmericanSouth American IndianSoviet UnionSpaniardSpanishSpanish AmericanSpanish American IndianSri LankanSubsaharan AfricanSudaneseSwedishSwissSyrianTaiwaneseThaiTlingit-HaidaTohono O'OdhamTonganTrinidadian and TobagonianTsimshianTurkishU.S. Virgin IslanderUgandanUkrainianUruguayanUteVenezuelanVietnameseWelshWest IndianYakamaYaquiYugoslavianYumanYup'ikZimbabwean
Immigration
NonimmigrantsImmigrantsAfghanistanAfricaAlbaniaArgentinaArmeniaAsiaAustraliaAustriaBahamasBangladeshBarbadosBelarusBelgiumBelizeBoliviaBosnia and HerzegovinaBrazilBulgariaBurma/MyanmarCabo VerdeCambodiaCameroonCanadaCaribbeanCentral AmericaChileChinaColombiaCongoCosta RicaCroatiaCubaCzechoslovakiaDenmarkDominicaDominican RepublicEastern AfricaEastern AsiaEastern EuropeEcuadorEgyptEl SalvadorEnglandEritreaEthiopiaEuropeFijiFranceGermanyGhanaGreeceGrenadaGuatemalaGuyanaHaitiHondurasHong KongHungaryIndiaIndonesiaIranIraqIrelandIsraelItalyJamaicaJapanJordanKazakhstanKenyaKoreaKuwaitLaosLatin AmericaLatviaLebanonLiberiaLithuaniaMalaysiaMexicoMicronesiaMiddle AfricaMoldovaMoroccoNepalNetherlandsNicaraguaNorth AmericaNorth MacedoniaNorthern AfricaNorthern EuropeNorwayOceaniaPakistanPanamaPeruPhilippinesPolandPortugalRomaniaRussiaSaudi ArabiaScotlandSenegalSerbiaSierra LeoneSingaporeSomaliaSouth AfricaSouth AmericaSouth Central AsiaSouth Eastern AsiaSouthern EuropeSpainSri LankaSt. Vincent and the GrenadinesSudanSwedenSwitzerlandSyriaTaiwanThailandTrinidad and TobagoTurkeyUgandaUkraineUruguayUzbekistanVenezuelaVietnamWest IndiesWestern AfricaWestern AsiaWestern EuropeYemenZaireZimbabweAzores
Immigrants from Nigeria
Race
Ancestry
AfghanAfricanAlaska NativeAlaskan AthabascanAlbanianAleutAlsatianAmericanApacheArabArapahoArgentineanArmenianAssyrian/Chaldean/SyriacAustralianAustrianBahamianBangladeshiBarbadianBasqueBelgianBelizeanBermudanBhutaneseBlackfeetBolivianBrazilianBritishBritish West IndianBulgarianBurmeseCajunCambodianCanadianCape VerdeanCarpatho RusynCelticCentral AmericanCentral American IndianCherokeeCheyenneChickasawChileanChineseChippewaChoctawColombianColvilleComancheCosta RicanCreeCreekCroatianCrowCubanCypriotCzechCzechoslovakianDanishDelawareDominicanDutchDutch West IndianEastern EuropeanEcuadorianEgyptianEnglishEstonianEthiopianEuropeanFijianFilipinoFinnishFrenchFrench American IndianFrench CanadianGermanGerman RussianGhanaianGreekGuamanian/ChamorroGuatemalanGuyaneseHaitianHmongHonduranHopiHoumaHungarianIcelanderIndian (Asian)IndonesianInupiatIranianIraqiIrishIroquoisIsraeliItalianJamaicanJapaneseJordanianKenyanKiowaKoreanLaotianLatvianLebaneseLiberianLithuanianLumbeeLuxembourgerMacedonianMalaysianMalteseMarshalleseMenomineeMexicanMexican American IndianMongolianMoroccanNative HawaiianNavajoNepaleseNew ZealanderNicaraguanNigerianNorthern EuropeanNorwegianOkinawanOsageOttawaPaiutePakistaniPalestinianPanamanianParaguayanPennsylvania GermanPeruvianPimaPolishPortuguesePotawatomiPuebloPuerto RicanPuget Sound SalishRomanianRussianSalvadoranSamoanScandinavianScotch-IrishScottishSeminoleSenegaleseSerbianShoshoneSierra LeoneanSiouxSlavicSlovakSloveneSomaliSouth AfricanSouth AmericanSouth American IndianSoviet UnionSpaniardSpanishSpanish AmericanSpanish American IndianSri LankanSudaneseSwedishSwissSyrianTaiwaneseThaiTlingit-HaidaTohono O'OdhamTonganTrinidadian and TobagonianTsimshianTurkishU.S. Virgin IslanderUgandanUkrainianUruguayanUteVenezuelanVietnameseWelshWest IndianYakamaYaquiYugoslavianYumanYup'ikZimbabwean
Immigration
NonimmigrantsImmigrantsAfghanistanAfricaAlbaniaArgentinaArmeniaAsiaAustraliaAustriaBahamasBangladeshBarbadosBelarusBelgiumBelizeBoliviaBosnia and HerzegovinaBrazilBulgariaBurma/MyanmarCabo VerdeCambodiaCameroonCanadaCaribbeanCentral AmericaChileChinaColombiaCongoCosta RicaCroatiaCubaCzechoslovakiaDenmarkDominicaDominican RepublicEastern AfricaEastern AsiaEastern EuropeEcuadorEgyptEl SalvadorEnglandEritreaEthiopiaEuropeFijiFranceGermanyGhanaGreeceGrenadaGuatemalaGuyanaHaitiHondurasHong KongHungaryIndiaIndonesiaIranIraqIrelandIsraelItalyJamaicaJapanJordanKazakhstanKenyaKoreaKuwaitLaosLatin AmericaLatviaLebanonLiberiaLithuaniaMalaysiaMexicoMicronesiaMiddle AfricaMoldovaMoroccoNepalNetherlandsNicaraguaNigeriaNorth AmericaNorth MacedoniaNorthern AfricaNorthern EuropeNorwayOceaniaPakistanPanamaPeruPhilippinesPolandPortugalRomaniaRussiaSaudi ArabiaScotlandSenegalSerbiaSierra LeoneSingaporeSomaliaSouth AfricaSouth AmericaSouth Central AsiaSouth Eastern AsiaSouthern EuropeSpainSri LankaSt. Vincent and the GrenadinesSudanSwedenSwitzerlandSyriaTaiwanThailandTrinidad and TobagoTurkeyUgandaUkraineUruguayUzbekistanVenezuelaVietnamWest IndiesWestern AfricaWestern AsiaWestern EuropeYemenZaireZimbabweAzores
Disability
Income
Poverty
Unemployment
Labor Participation
Family Structure
Vehicle Availability
Education Level
Disability

Disability Comparison

Sub-Saharan Africans

Immigrants from Nigeria

Tragic
Exceptional
12.3%
DISABILITY
1.4/ 100
METRIC RATING
250th/ 347
METRIC RANK
11.3%
DISABILITY
96.0/ 100
METRIC RATING
108th/ 347
METRIC RANK

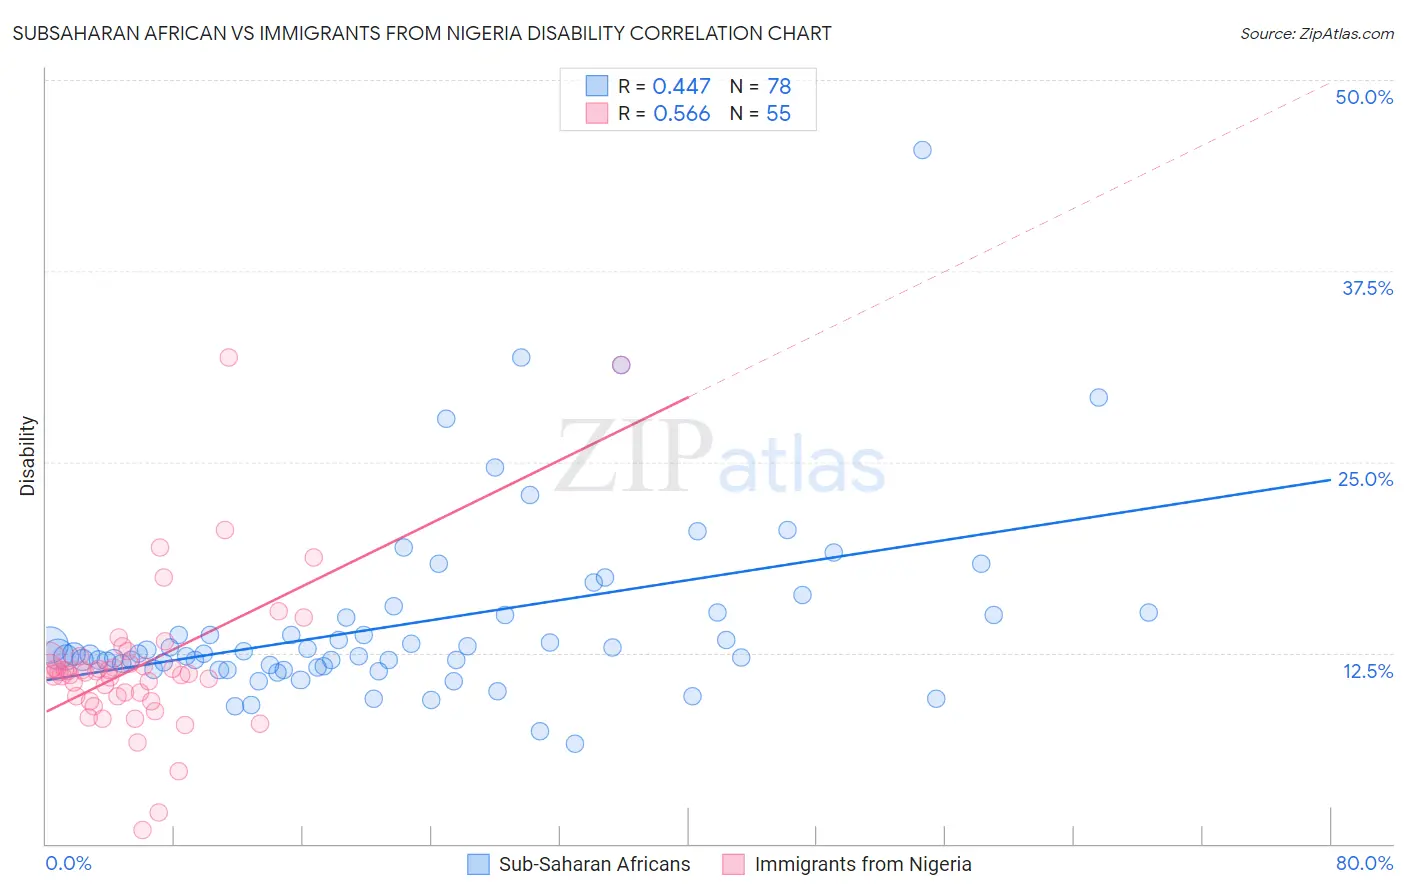
Subsaharan African vs Immigrants from Nigeria Disability Correlation Chart

The statistical analysis conducted on geographies consisting of 508,103,774 people shows a moderate positive correlation between the proportion of Sub-Saharan Africans and percentage of population with a disability in the United States with a correlation coefficient (R) of 0.447 and weighted average of 12.3%. Similarly, the statistical analysis conducted on geographies consisting of 283,478,180 people shows a substantial positive correlation between the proportion of Immigrants from Nigeria and percentage of population with a disability in the United States with a correlation coefficient (R) of 0.566 and weighted average of 11.3%, a difference of 8.6%.
Subsaharan African vs Immigrants from Nigeria Disability

Disability Correlation Summary

MeasurementSubsaharan AfricanImmigrants from Nigeria
Minimum6.6%0.93%
Maximum45.5%31.8%
Range38.9%30.9%
Mean14.4%11.7%
Median12.4%11.2%
Interquartile 25% (IQ1)11.6%9.6%
Interquartile 75% (IQ3)14.9%12.0%
Interquartile Range (IQR)3.3%2.4%
Standard Deviation (Sample)6.1%5.2%
Standard Deviation (Population)6.0%5.1%

Similar Demographics by Disability

Demographics Similar to Sub-Saharan Africans by Disability

In terms of disability, the demographic groups most similar to Sub-Saharan Africans are European (12.3%, a difference of 0.0%), Carpatho Rusyn (12.3%, a difference of 0.010%), Guamanian/Chamorro (12.3%, a difference of 0.020%), Indonesian (12.2%, a difference of 0.060%), and Swiss (12.2%, a difference of 0.090%).
DemographicsRating | RankDisability
British
1.5
/100
|
#243
Tragic
12.2%
Basques
1.5
/100
|
#244
Tragic
12.2%
Liberians
1.5
/100
|
#245
Tragic
12.2%
Swiss
1.5
/100
|
#246
Tragic
12.2%
Indonesians
1.4
/100
|
#247
Tragic
12.2%
Guamanians/Chamorros
1.4
/100
|
#248
Tragic
12.3%
Carpatho Rusyns
1.4
/100
|
#249
Tragic
12.3%
Sub-Saharan Africans
1.4
/100
|
#250
Tragic
12.3%
Europeans
1.4
/100
|
#251
Tragic
12.3%
Bermudans
1.1
/100
|
#252
Tragic
12.3%
Belgians
0.8
/100
|
#253
Tragic
12.3%
German Russians
0.8
/100
|
#254
Tragic
12.3%
Slovenes
0.6
/100
|
#255
Tragic
12.4%
Immigrants | Dominica
0.6
/100
|
#256
Tragic
12.4%
Immigrants | Laos
0.5
/100
|
#257
Tragic
12.4%

Demographics Similar to Immigrants from Nigeria by Disability

In terms of disability, the demographic groups most similar to Immigrants from Nigeria are Nicaraguan (11.3%, a difference of 0.080%), Immigrants from Uganda (11.3%, a difference of 0.080%), Immigrants from Eastern Europe (11.3%, a difference of 0.10%), Immigrants from Denmark (11.3%, a difference of 0.10%), and Immigrants from Kazakhstan (11.3%, a difference of 0.13%).
DemographicsRating | RankDisability
Immigrants | Nicaragua
96.8
/100
|
#101
Exceptional
11.3%
Immigrants | Eastern Africa
96.7
/100
|
#102
Exceptional
11.3%
Immigrants | Uruguay
96.4
/100
|
#103
Exceptional
11.3%
Immigrants | Immigrants
96.4
/100
|
#104
Exceptional
11.3%
Immigrants | Kazakhstan
96.4
/100
|
#105
Exceptional
11.3%
Immigrants | Eastern Europe
96.3
/100
|
#106
Exceptional
11.3%
Nicaraguans
96.2
/100
|
#107
Exceptional
11.3%
Immigrants | Nigeria
96.0
/100
|
#108
Exceptional
11.3%
Immigrants | Uganda
95.7
/100
|
#109
Exceptional
11.3%
Immigrants | Denmark
95.6
/100
|
#110
Exceptional
11.3%
Immigrants | South Eastern Asia
95.4
/100
|
#111
Exceptional
11.3%
Immigrants | Uzbekistan
94.9
/100
|
#112
Exceptional
11.3%
Guyanese
94.7
/100
|
#113
Exceptional
11.3%
Immigrants | Syria
94.7
/100
|
#114
Exceptional
11.3%
Immigrants | Philippines
94.6
/100
|
#115
Exceptional
11.3%