Subsaharan African vs Immigrants from Congo Male Unemployment
COMPARE
Subsaharan African
Immigrants from Congo
Male Unemployment
Male Unemployment Comparison
Sub-Saharan Africans
Immigrants from Congo
6.0%
MALE UNEMPLOYMENT
0.0/ 100
METRIC RATING
270th/ 347
METRIC RANK
5.3%
MALE UNEMPLOYMENT
57.4/ 100
METRIC RATING
169th/ 347
METRIC RANK
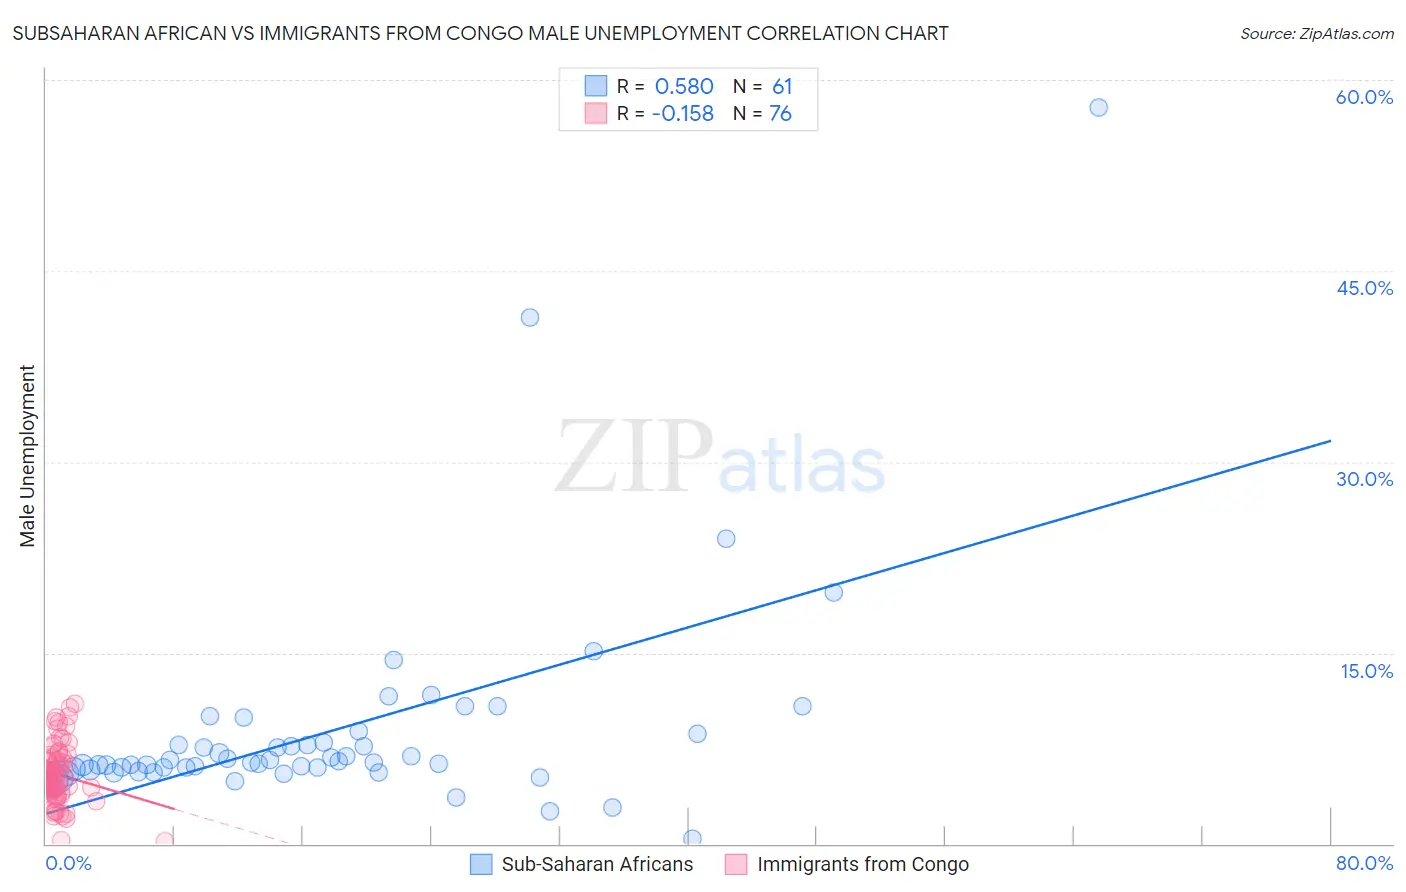
Subsaharan African vs Immigrants from Congo Male Unemployment Correlation Chart
The statistical analysis conducted on geographies consisting of 504,185,655 people shows a substantial positive correlation between the proportion of Sub-Saharan Africans and unemployment rate among males in the United States with a correlation coefficient (R) of 0.580 and weighted average of 6.0%. Similarly, the statistical analysis conducted on geographies consisting of 92,075,250 people shows a poor negative correlation between the proportion of Immigrants from Congo and unemployment rate among males in the United States with a correlation coefficient (R) of -0.158 and weighted average of 5.3%, a difference of 13.1%.
Male Unemployment Correlation Summary
| Measurement | Subsaharan African | Immigrants from Congo |
| Minimum | 0.40% | 0.20% |
| Maximum | 57.8% | 11.0% |
| Range | 57.4% | 10.8% |
| Mean | 8.9% | 5.4% |
| Median | 6.4% | 5.1% |
| Interquartile 25% (IQ1) | 5.8% | 4.1% |
| Interquartile 75% (IQ3) | 8.3% | 6.7% |
| Interquartile Range (IQR) | 2.5% | 2.6% |
| Standard Deviation (Sample) | 8.5% | 2.3% |
| Standard Deviation (Population) | 8.5% | 2.3% |
Similar Demographics by Male Unemployment
Demographics Similar to Sub-Saharan Africans by Male Unemployment
In terms of male unemployment, the demographic groups most similar to Sub-Saharan Africans are Immigrants from Nigeria (6.0%, a difference of 0.13%), Bermudan (5.9%, a difference of 0.40%), Blackfeet (6.0%, a difference of 0.50%), Nigerian (5.9%, a difference of 0.61%), and Immigrants from Uzbekistan (6.0%, a difference of 0.73%).
| Demographics | Rating | Rank | Male Unemployment |
| Immigrants | Latin America | 0.1 /100 | #263 | Tragic 5.9% |
| Immigrants | Mexico | 0.0 /100 | #264 | Tragic 5.9% |
| French American Indians | 0.0 /100 | #265 | Tragic 5.9% |
| Bahamians | 0.0 /100 | #266 | Tragic 5.9% |
| Nigerians | 0.0 /100 | #267 | Tragic 5.9% |
| Bermudans | 0.0 /100 | #268 | Tragic 5.9% |
| Immigrants | Nigeria | 0.0 /100 | #269 | Tragic 6.0% |
| Sub-Saharan Africans | 0.0 /100 | #270 | Tragic 6.0% |
| Blackfeet | 0.0 /100 | #271 | Tragic 6.0% |
| Immigrants | Uzbekistan | 0.0 /100 | #272 | Tragic 6.0% |
| Armenians | 0.0 /100 | #273 | Tragic 6.0% |
| Immigrants | Sierra Leone | 0.0 /100 | #274 | Tragic 6.0% |
| Menominee | 0.0 /100 | #275 | Tragic 6.0% |
| Tlingit-Haida | 0.0 /100 | #276 | Tragic 6.0% |
| Immigrants | Liberia | 0.0 /100 | #277 | Tragic 6.1% |
Demographics Similar to Immigrants from Congo by Male Unemployment
In terms of male unemployment, the demographic groups most similar to Immigrants from Congo are Immigrants from Ireland (5.3%, a difference of 0.020%), Immigrants from Vietnam (5.3%, a difference of 0.040%), Immigrants from Morocco (5.3%, a difference of 0.17%), South American (5.3%, a difference of 0.20%), and Immigrants from Eastern Europe (5.3%, a difference of 0.20%).
| Demographics | Rating | Rank | Male Unemployment |
| Immigrants | Egypt | 65.9 /100 | #162 | Good 5.2% |
| Immigrants | Hong Kong | 65.7 /100 | #163 | Good 5.2% |
| Afghans | 62.0 /100 | #164 | Good 5.3% |
| South Americans | 60.6 /100 | #165 | Good 5.3% |
| Immigrants | Morocco | 60.2 /100 | #166 | Good 5.3% |
| Immigrants | Vietnam | 58.1 /100 | #167 | Average 5.3% |
| Immigrants | Ireland | 57.7 /100 | #168 | Average 5.3% |
| Immigrants | Congo | 57.4 /100 | #169 | Average 5.3% |
| Immigrants | Eastern Europe | 54.1 /100 | #170 | Average 5.3% |
| Peruvians | 51.9 /100 | #171 | Average 5.3% |
| Immigrants | Kazakhstan | 50.8 /100 | #172 | Average 5.3% |
| Immigrants | Russia | 50.7 /100 | #173 | Average 5.3% |
| Immigrants | Iran | 50.0 /100 | #174 | Average 5.3% |
| Immigrants | Iraq | 48.1 /100 | #175 | Average 5.3% |
| Immigrants | Poland | 46.0 /100 | #176 | Average 5.3% |