Yugoslavian vs Immigrants from Nigeria Male Unemployment
COMPARE
Yugoslavian
Immigrants from Nigeria
Male Unemployment
Male Unemployment Comparison
Yugoslavians
Immigrants from Nigeria
5.0%
MALE UNEMPLOYMENT
98.7/ 100
METRIC RATING
54th/ 347
METRIC RANK
6.0%
MALE UNEMPLOYMENT
0.0/ 100
METRIC RATING
269th/ 347
METRIC RANK
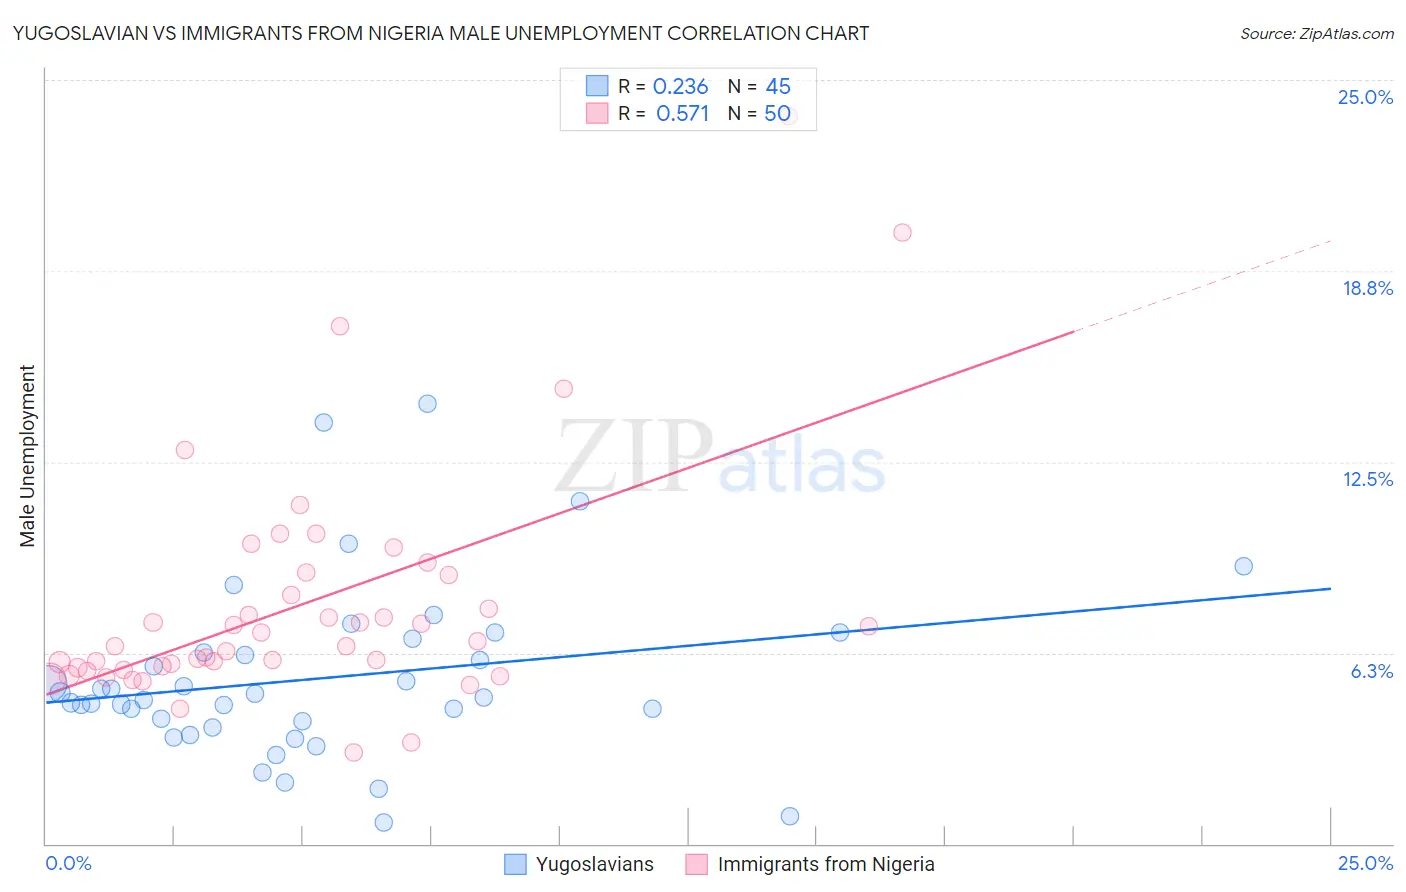
Yugoslavian vs Immigrants from Nigeria Male Unemployment Correlation Chart
The statistical analysis conducted on geographies consisting of 284,881,859 people shows a weak positive correlation between the proportion of Yugoslavians and unemployment rate among males in the United States with a correlation coefficient (R) of 0.236 and weighted average of 5.0%. Similarly, the statistical analysis conducted on geographies consisting of 282,980,898 people shows a substantial positive correlation between the proportion of Immigrants from Nigeria and unemployment rate among males in the United States with a correlation coefficient (R) of 0.571 and weighted average of 6.0%, a difference of 20.0%.
Male Unemployment Correlation Summary
| Measurement | Yugoslavian | Immigrants from Nigeria |
| Minimum | 0.70% | 3.0% |
| Maximum | 14.4% | 23.8% |
| Range | 13.7% | 20.8% |
| Mean | 5.4% | 7.8% |
| Median | 4.8% | 6.6% |
| Interquartile 25% (IQ1) | 3.9% | 5.8% |
| Interquartile 75% (IQ3) | 6.5% | 8.8% |
| Interquartile Range (IQR) | 2.6% | 3.0% |
| Standard Deviation (Sample) | 2.8% | 3.9% |
| Standard Deviation (Population) | 2.8% | 3.9% |
Similar Demographics by Male Unemployment
Demographics Similar to Yugoslavians by Male Unemployment
In terms of male unemployment, the demographic groups most similar to Yugoslavians are Czechoslovakian (5.0%, a difference of 0.0%), Immigrants from Bulgaria (5.0%, a difference of 0.010%), Jordanian (5.0%, a difference of 0.10%), Irish (5.0%, a difference of 0.16%), and Slovene (5.0%, a difference of 0.18%).
| Demographics | Rating | Rank | Male Unemployment |
| Austrians | 98.9 /100 | #47 | Exceptional 4.9% |
| Immigrants | Scotland | 98.9 /100 | #48 | Exceptional 4.9% |
| Poles | 98.9 /100 | #49 | Exceptional 4.9% |
| Croatians | 98.9 /100 | #50 | Exceptional 4.9% |
| Slovenes | 98.8 /100 | #51 | Exceptional 5.0% |
| Irish | 98.8 /100 | #52 | Exceptional 5.0% |
| Jordanians | 98.8 /100 | #53 | Exceptional 5.0% |
| Yugoslavians | 98.7 /100 | #54 | Exceptional 5.0% |
| Czechoslovakians | 98.7 /100 | #55 | Exceptional 5.0% |
| Immigrants | Bulgaria | 98.7 /100 | #56 | Exceptional 5.0% |
| Turks | 98.5 /100 | #57 | Exceptional 5.0% |
| Lithuanians | 98.5 /100 | #58 | Exceptional 5.0% |
| Immigrants | Netherlands | 98.3 /100 | #59 | Exceptional 5.0% |
| Immigrants | Argentina | 98.1 /100 | #60 | Exceptional 5.0% |
| Cambodians | 98.1 /100 | #61 | Exceptional 5.0% |
Demographics Similar to Immigrants from Nigeria by Male Unemployment
In terms of male unemployment, the demographic groups most similar to Immigrants from Nigeria are Subsaharan African (6.0%, a difference of 0.13%), Bermudan (5.9%, a difference of 0.27%), Nigerian (5.9%, a difference of 0.48%), Bahamian (5.9%, a difference of 0.60%), and Blackfeet (6.0%, a difference of 0.64%).
| Demographics | Rating | Rank | Male Unemployment |
| Immigrants | Portugal | 0.1 /100 | #262 | Tragic 5.9% |
| Immigrants | Latin America | 0.1 /100 | #263 | Tragic 5.9% |
| Immigrants | Mexico | 0.0 /100 | #264 | Tragic 5.9% |
| French American Indians | 0.0 /100 | #265 | Tragic 5.9% |
| Bahamians | 0.0 /100 | #266 | Tragic 5.9% |
| Nigerians | 0.0 /100 | #267 | Tragic 5.9% |
| Bermudans | 0.0 /100 | #268 | Tragic 5.9% |
| Immigrants | Nigeria | 0.0 /100 | #269 | Tragic 6.0% |
| Sub-Saharan Africans | 0.0 /100 | #270 | Tragic 6.0% |
| Blackfeet | 0.0 /100 | #271 | Tragic 6.0% |
| Immigrants | Uzbekistan | 0.0 /100 | #272 | Tragic 6.0% |
| Armenians | 0.0 /100 | #273 | Tragic 6.0% |
| Immigrants | Sierra Leone | 0.0 /100 | #274 | Tragic 6.0% |
| Menominee | 0.0 /100 | #275 | Tragic 6.0% |
| Tlingit-Haida | 0.0 /100 | #276 | Tragic 6.0% |