Spanish vs Japanese Male Unemployment
COMPARE
Spanish
Japanese
Male Unemployment
Male Unemployment Comparison
Spanish
Japanese
5.4%
MALE UNEMPLOYMENT
19.7/ 100
METRIC RATING
194th/ 347
METRIC RANK
5.8%
MALE UNEMPLOYMENT
0.2/ 100
METRIC RATING
254th/ 347
METRIC RANK
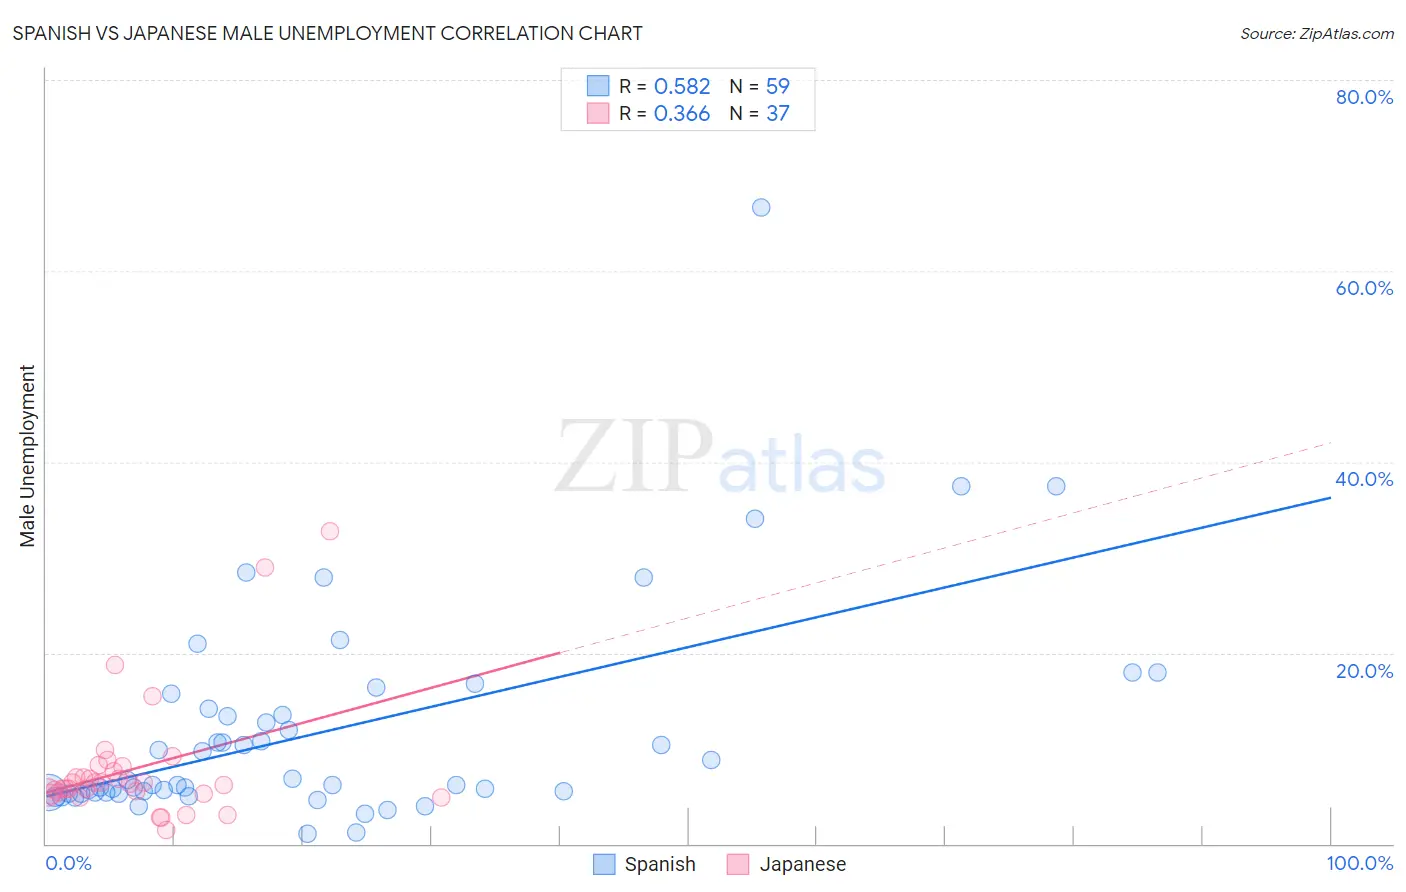
Spanish vs Japanese Male Unemployment Correlation Chart
The statistical analysis conducted on geographies consisting of 419,777,027 people shows a substantial positive correlation between the proportion of Spanish and unemployment rate among males in the United States with a correlation coefficient (R) of 0.582 and weighted average of 5.4%. Similarly, the statistical analysis conducted on geographies consisting of 248,784,678 people shows a mild positive correlation between the proportion of Japanese and unemployment rate among males in the United States with a correlation coefficient (R) of 0.366 and weighted average of 5.8%, a difference of 7.0%.
Male Unemployment Correlation Summary
| Measurement | Spanish | Japanese |
| Minimum | 1.1% | 1.5% |
| Maximum | 66.7% | 32.7% |
| Range | 65.6% | 31.2% |
| Mean | 11.8% | 7.9% |
| Median | 6.2% | 6.3% |
| Interquartile 25% (IQ1) | 5.3% | 5.3% |
| Interquartile 75% (IQ3) | 14.1% | 7.9% |
| Interquartile Range (IQR) | 8.8% | 2.6% |
| Standard Deviation (Sample) | 11.4% | 6.4% |
| Standard Deviation (Population) | 11.3% | 6.3% |
Similar Demographics by Male Unemployment
Demographics Similar to Spanish by Male Unemployment
In terms of male unemployment, the demographic groups most similar to Spanish are Immigrants from Southern Europe (5.4%, a difference of 0.18%), Albanian (5.4%, a difference of 0.22%), Alsatian (5.4%, a difference of 0.28%), Immigrants from Israel (5.4%, a difference of 0.46%), and Immigrants from Thailand (5.4%, a difference of 0.50%).
| Demographics | Rating | Rank | Male Unemployment |
| Costa Ricans | 31.3 /100 | #187 | Fair 5.4% |
| Arabs | 30.2 /100 | #188 | Fair 5.4% |
| Immigrants | South America | 29.4 /100 | #189 | Fair 5.4% |
| Immigrants | Uganda | 28.8 /100 | #190 | Fair 5.4% |
| Immigrants | South Eastern Asia | 28.2 /100 | #191 | Fair 5.4% |
| Immigrants | Belarus | 26.0 /100 | #192 | Fair 5.4% |
| Immigrants | Israel | 25.2 /100 | #193 | Fair 5.4% |
| Spanish | 19.7 /100 | #194 | Poor 5.4% |
| Immigrants | Southern Europe | 17.7 /100 | #195 | Poor 5.4% |
| Albanians | 17.3 /100 | #196 | Poor 5.4% |
| Alsatians | 16.7 /100 | #197 | Poor 5.4% |
| Immigrants | Thailand | 14.7 /100 | #198 | Poor 5.4% |
| Immigrants | Greece | 14.5 /100 | #199 | Poor 5.4% |
| Immigrants | Zaire | 13.7 /100 | #200 | Poor 5.4% |
| Immigrants | Philippines | 13.5 /100 | #201 | Poor 5.4% |
Demographics Similar to Japanese by Male Unemployment
In terms of male unemployment, the demographic groups most similar to Japanese are Kiowa (5.8%, a difference of 0.10%), Mexican American Indian (5.8%, a difference of 0.17%), Comanche (5.8%, a difference of 0.18%), Mexican (5.8%, a difference of 0.30%), and Hispanic or Latino (5.8%, a difference of 0.35%).
| Demographics | Rating | Rank | Male Unemployment |
| Hawaiians | 0.6 /100 | #247 | Tragic 5.7% |
| Marshallese | 0.5 /100 | #248 | Tragic 5.7% |
| Cree | 0.4 /100 | #249 | Tragic 5.7% |
| Immigrants | Bahamas | 0.4 /100 | #250 | Tragic 5.7% |
| Spanish Americans | 0.3 /100 | #251 | Tragic 5.7% |
| Mexicans | 0.2 /100 | #252 | Tragic 5.8% |
| Mexican American Indians | 0.2 /100 | #253 | Tragic 5.8% |
| Japanese | 0.2 /100 | #254 | Tragic 5.8% |
| Kiowa | 0.2 /100 | #255 | Tragic 5.8% |
| Comanche | 0.2 /100 | #256 | Tragic 5.8% |
| Hispanics or Latinos | 0.1 /100 | #257 | Tragic 5.8% |
| Dutch West Indians | 0.1 /100 | #258 | Tragic 5.8% |
| Cajuns | 0.1 /100 | #259 | Tragic 5.8% |
| Immigrants | Central America | 0.1 /100 | #260 | Tragic 5.8% |
| Liberians | 0.1 /100 | #261 | Tragic 5.8% |