Spanish vs Immigrants from Ecuador Male Unemployment
COMPARE
Spanish
Immigrants from Ecuador
Male Unemployment
Male Unemployment Comparison
Spanish
Immigrants from Ecuador
5.4%
MALE UNEMPLOYMENT
19.7/ 100
METRIC RATING
194th/ 347
METRIC RANK
6.2%
MALE UNEMPLOYMENT
0.0/ 100
METRIC RATING
285th/ 347
METRIC RANK
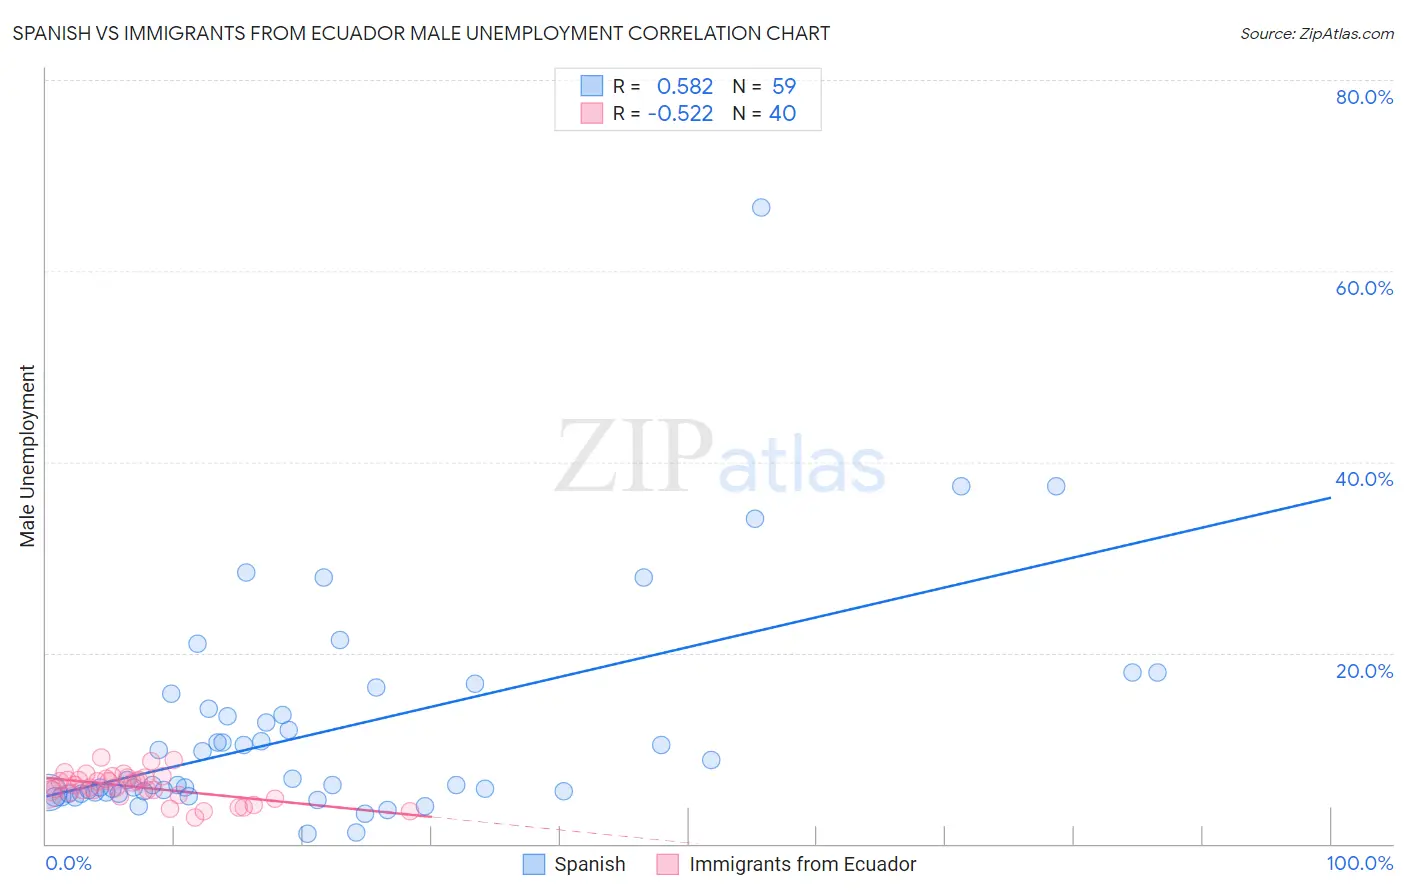
Spanish vs Immigrants from Ecuador Male Unemployment Correlation Chart
The statistical analysis conducted on geographies consisting of 419,777,027 people shows a substantial positive correlation between the proportion of Spanish and unemployment rate among males in the United States with a correlation coefficient (R) of 0.582 and weighted average of 5.4%. Similarly, the statistical analysis conducted on geographies consisting of 270,419,608 people shows a substantial negative correlation between the proportion of Immigrants from Ecuador and unemployment rate among males in the United States with a correlation coefficient (R) of -0.522 and weighted average of 6.2%, a difference of 15.3%.
Male Unemployment Correlation Summary
| Measurement | Spanish | Immigrants from Ecuador |
| Minimum | 1.1% | 2.7% |
| Maximum | 66.7% | 9.0% |
| Range | 65.6% | 6.3% |
| Mean | 11.8% | 6.0% |
| Median | 6.2% | 6.0% |
| Interquartile 25% (IQ1) | 5.3% | 5.2% |
| Interquartile 75% (IQ3) | 14.1% | 6.9% |
| Interquartile Range (IQR) | 8.8% | 1.7% |
| Standard Deviation (Sample) | 11.4% | 1.5% |
| Standard Deviation (Population) | 11.3% | 1.5% |
Similar Demographics by Male Unemployment
Demographics Similar to Spanish by Male Unemployment
In terms of male unemployment, the demographic groups most similar to Spanish are Immigrants from Southern Europe (5.4%, a difference of 0.18%), Albanian (5.4%, a difference of 0.22%), Alsatian (5.4%, a difference of 0.28%), Immigrants from Israel (5.4%, a difference of 0.46%), and Immigrants from Thailand (5.4%, a difference of 0.50%).
| Demographics | Rating | Rank | Male Unemployment |
| Costa Ricans | 31.3 /100 | #187 | Fair 5.4% |
| Arabs | 30.2 /100 | #188 | Fair 5.4% |
| Immigrants | South America | 29.4 /100 | #189 | Fair 5.4% |
| Immigrants | Uganda | 28.8 /100 | #190 | Fair 5.4% |
| Immigrants | South Eastern Asia | 28.2 /100 | #191 | Fair 5.4% |
| Immigrants | Belarus | 26.0 /100 | #192 | Fair 5.4% |
| Immigrants | Israel | 25.2 /100 | #193 | Fair 5.4% |
| Spanish | 19.7 /100 | #194 | Poor 5.4% |
| Immigrants | Southern Europe | 17.7 /100 | #195 | Poor 5.4% |
| Albanians | 17.3 /100 | #196 | Poor 5.4% |
| Alsatians | 16.7 /100 | #197 | Poor 5.4% |
| Immigrants | Thailand | 14.7 /100 | #198 | Poor 5.4% |
| Immigrants | Greece | 14.5 /100 | #199 | Poor 5.4% |
| Immigrants | Zaire | 13.7 /100 | #200 | Poor 5.4% |
| Immigrants | Philippines | 13.5 /100 | #201 | Poor 5.4% |
Demographics Similar to Immigrants from Ecuador by Male Unemployment
In terms of male unemployment, the demographic groups most similar to Immigrants from Ecuador are Spanish American Indian (6.2%, a difference of 0.020%), African (6.3%, a difference of 0.43%), Immigrants from Western Africa (6.2%, a difference of 0.67%), Ecuadorian (6.2%, a difference of 0.70%), and Central American Indian (6.3%, a difference of 0.72%).
| Demographics | Rating | Rank | Male Unemployment |
| Immigrants | Fiji | 0.0 /100 | #278 | Tragic 6.1% |
| Ghanaians | 0.0 /100 | #279 | Tragic 6.1% |
| Immigrants | Ghana | 0.0 /100 | #280 | Tragic 6.2% |
| Sierra Leoneans | 0.0 /100 | #281 | Tragic 6.2% |
| Ecuadorians | 0.0 /100 | #282 | Tragic 6.2% |
| Immigrants | Western Africa | 0.0 /100 | #283 | Tragic 6.2% |
| Spanish American Indians | 0.0 /100 | #284 | Tragic 6.2% |
| Immigrants | Ecuador | 0.0 /100 | #285 | Tragic 6.2% |
| Africans | 0.0 /100 | #286 | Tragic 6.3% |
| Central American Indians | 0.0 /100 | #287 | Tragic 6.3% |
| Immigrants | Senegal | 0.0 /100 | #288 | Tragic 6.3% |
| Immigrants | Caribbean | 0.0 /100 | #289 | Tragic 6.3% |
| U.S. Virgin Islanders | 0.0 /100 | #290 | Tragic 6.4% |
| Immigrants | Azores | 0.0 /100 | #291 | Tragic 6.4% |
| Nepalese | 0.0 /100 | #292 | Tragic 6.4% |