Native/Alaskan vs White/Caucasian Unemployment Among Youth under 25 years
COMPARE
Native/Alaskan
White/Caucasian
Unemployment Among Youth under 25 years
Unemployment Among Youth under 25 years Comparison
Natives/Alaskans
Whites/Caucasians
14.5%
UNEMPLOYMENT AMONG YOUTH UNDER 25 YEARS
0.0/ 100
METRIC RATING
316th/ 347
METRIC RANK
11.2%
UNEMPLOYMENT AMONG YOUTH UNDER 25 YEARS
96.9/ 100
METRIC RATING
77th/ 347
METRIC RANK
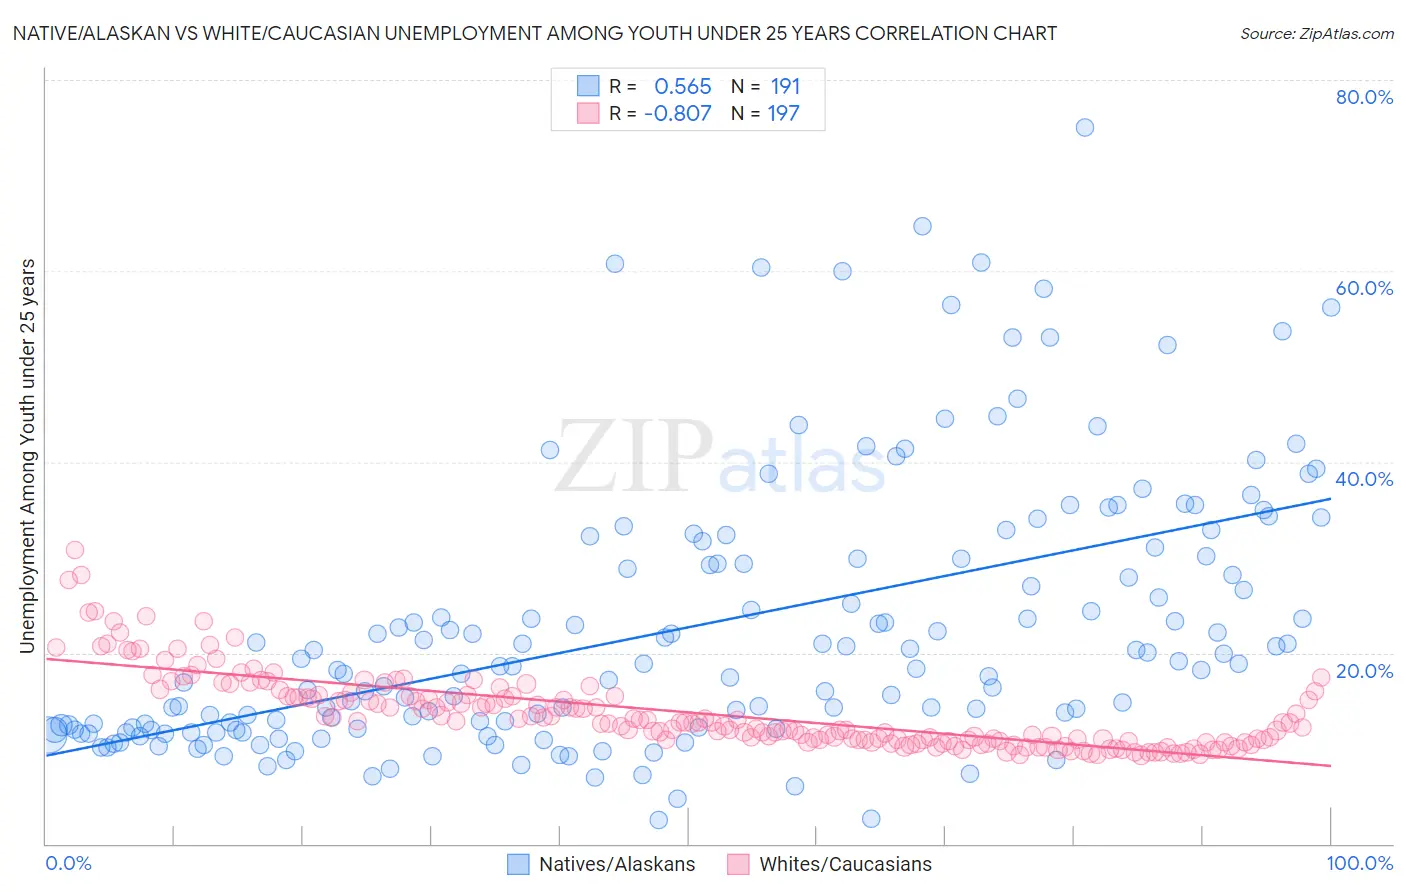
Native/Alaskan vs White/Caucasian Unemployment Among Youth under 25 years Correlation Chart
The statistical analysis conducted on geographies consisting of 499,955,356 people shows a substantial positive correlation between the proportion of Natives/Alaskans and unemployment rate among youth under the age of 25 in the United States with a correlation coefficient (R) of 0.565 and weighted average of 14.5%. Similarly, the statistical analysis conducted on geographies consisting of 555,079,229 people shows a very strong negative correlation between the proportion of Whites/Caucasians and unemployment rate among youth under the age of 25 in the United States with a correlation coefficient (R) of -0.807 and weighted average of 11.2%, a difference of 29.2%.
Unemployment Among Youth under 25 years Correlation Summary
| Measurement | Native/Alaskan | White/Caucasian |
| Minimum | 2.4% | 9.2% |
| Maximum | 75.0% | 30.8% |
| Range | 72.6% | 21.5% |
| Mean | 22.6% | 13.7% |
| Median | 18.5% | 12.7% |
| Interquartile 25% (IQ1) | 12.0% | 10.8% |
| Interquartile 75% (IQ3) | 29.9% | 15.5% |
| Interquartile Range (IQR) | 17.9% | 4.7% |
| Standard Deviation (Sample) | 14.0% | 4.0% |
| Standard Deviation (Population) | 14.0% | 3.9% |
Similar Demographics by Unemployment Among Youth under 25 years
Demographics Similar to Natives/Alaskans by Unemployment Among Youth under 25 years
In terms of unemployment among youth under 25 years, the demographic groups most similar to Natives/Alaskans are Black/African American (14.5%, a difference of 0.090%), Sioux (14.4%, a difference of 0.42%), Jamaican (14.4%, a difference of 0.54%), Immigrants from Armenia (14.4%, a difference of 0.63%), and Immigrants from Dominica (14.6%, a difference of 0.80%).
| Demographics | Rating | Rank | Unemployment Among Youth under 25 years |
| Aleuts | 0.0 /100 | #309 | Tragic 14.1% |
| Immigrants | West Indies | 0.0 /100 | #310 | Tragic 14.2% |
| Immigrants | Bangladesh | 0.0 /100 | #311 | Tragic 14.2% |
| Vietnamese | 0.0 /100 | #312 | Tragic 14.3% |
| Immigrants | Armenia | 0.0 /100 | #313 | Tragic 14.4% |
| Jamaicans | 0.0 /100 | #314 | Tragic 14.4% |
| Sioux | 0.0 /100 | #315 | Tragic 14.4% |
| Natives/Alaskans | 0.0 /100 | #316 | Tragic 14.5% |
| Blacks/African Americans | 0.0 /100 | #317 | Tragic 14.5% |
| Immigrants | Dominica | 0.0 /100 | #318 | Tragic 14.6% |
| West Indians | 0.0 /100 | #319 | Tragic 14.6% |
| Barbadians | 0.0 /100 | #320 | Tragic 14.6% |
| Cheyenne | 0.0 /100 | #321 | Tragic 14.6% |
| Trinidadians and Tobagonians | 0.0 /100 | #322 | Tragic 14.6% |
| Immigrants | Trinidad and Tobago | 0.0 /100 | #323 | Tragic 14.6% |
Demographics Similar to Whites/Caucasians by Unemployment Among Youth under 25 years
In terms of unemployment among youth under 25 years, the demographic groups most similar to Whites/Caucasians are German Russian (11.2%, a difference of 0.050%), Immigrants from Nicaragua (11.2%, a difference of 0.060%), Immigrants from Canada (11.2%, a difference of 0.070%), French (11.2%, a difference of 0.080%), and New Zealander (11.2%, a difference of 0.11%).
| Demographics | Rating | Rank | Unemployment Among Youth under 25 years |
| Slavs | 97.5 /100 | #70 | Exceptional 11.2% |
| Bhutanese | 97.4 /100 | #71 | Exceptional 11.2% |
| Immigrants | Australia | 97.3 /100 | #72 | Exceptional 11.2% |
| Creek | 97.2 /100 | #73 | Exceptional 11.2% |
| New Zealanders | 97.2 /100 | #74 | Exceptional 11.2% |
| French | 97.1 /100 | #75 | Exceptional 11.2% |
| German Russians | 97.0 /100 | #76 | Exceptional 11.2% |
| Whites/Caucasians | 96.9 /100 | #77 | Exceptional 11.2% |
| Immigrants | Nicaragua | 96.7 /100 | #78 | Exceptional 11.2% |
| Immigrants | Canada | 96.7 /100 | #79 | Exceptional 11.2% |
| Immigrants | Bulgaria | 96.4 /100 | #80 | Exceptional 11.2% |
| Icelanders | 96.3 /100 | #81 | Exceptional 11.2% |
| Northern Europeans | 96.2 /100 | #82 | Exceptional 11.2% |
| Bolivians | 96.1 /100 | #83 | Exceptional 11.2% |
| French Canadians | 95.9 /100 | #84 | Exceptional 11.2% |